Supercuts 2011 Annual Report Download - page 62
Download and view the complete annual report
Please find page 62 of the 2011 Supercuts annual report below. You can navigate through the pages in the report by either clicking on the pages listed below, or by using the keyword search tool below to find specific information within the annual report.-
 1
1 -
2
-
3
-
4
-
5
-
6
-
7
-
8
-
9
-
10
-
11
-
12
-
13
-
14
-
15
-
16
-
17
-
18
-
19
-
20
-
21
-
22
-
23
-
24
-
25
-
26
-
27
-
28
-
29
-
30
-
31
-
32
-
33
-
34
-
35
-
36
-
37
-
38
-
39
-
40
-
41
-
42
-
43
-
44
-
45
-
46
-
47
-
48
-
49
-
50
-
51
-
 52
52 -
 53
53 -
 54
54 -
 55
55 -
 56
56 -
 57
57 -
 58
58 -
 59
59 -
 60
60 -
 61
61 -
 62
62 -
 63
63 -
 64
64 -
 65
65 -
 66
66 -
 67
67 -
 68
68 -
 69
69 -
 70
70 -
 71
71 -
 72
72 -
73
-
74
-
75
-
76
-
77
-
78
-
79
-
80
-
81
-
82
-
83
-
84
-
85
-
86
-
87
-
88
-
89
-
90
-
91
-
92
-
93
-
94
-
95
-
96
-
97
-
98
-
99
-
100
-
101
-
102
-
103
-
104
-
105
-
106
-
107
-
108
-
109
-
110
-
111
-
112
-
113
-
114
-
115
-
116
-
117
-
118
-
119
-
120
-
121
-
122
-
123
-
124
-
125
-
126
-
127
-
128
-
129
-
130
-
131
-
132
-
133
-
134
-
135
-
136
-
137
-
138
-
139
-
140
-
141
-
142
-
143
-
144
-
145
-
146
-
147
-
148
-
149
-
150
-
151
-
152
-
153
-
154
-
155
-
156
-
157
-
158
-
159
-
160
-
161
-
162
-
163
-
164
-
165
-
166
-
167
-
168
-
169
-
170
-
171
-
172
-
173
-
174
-
175
-
176
-
177
-
178
 |
 |

Table of Contents
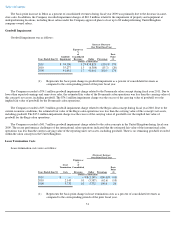
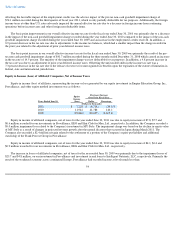
The basis point improvement in International salon operating income as a percent of International salon revenues during fiscal year 2011
was primarily due to $2.1 million of lease termination costs recognized during fiscal year 2010 associated with the Company's planned closure of
underperforming salons. Partially offsetting the basis point improvement was a decline on product margins from mix play, as a larger than
expected percentage of our product sales came from lower-margin products.
The basis point improvement in International salon operating income as a percent of International salon revenues during fiscal year 2010
was primarily due to the comparable prior period including a $41.7 million goodwill impairment of the United Kingdom reporting unit and
higher impairment charges related to the impairment of property and equipment at underperforming locations. In addition the Company's
planned closure of underperforming United Kingdom salons and the continuation of the Company's expense control and payroll management
contributed to the basis point improvement during fiscal year 2010.
The basis point decrease in International salon operating income as a percent of International salon revenues during fiscal year 2009 was
primarily due to negative same-store sales and the $41.7 million goodwill impairment of the United Kingdom reporting unit during the fiscal
year 2009.
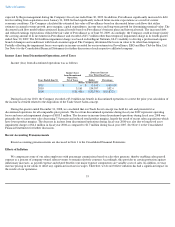
Hair Restoration Centers
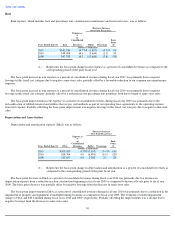
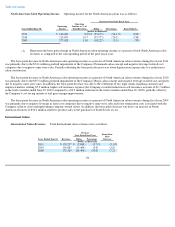
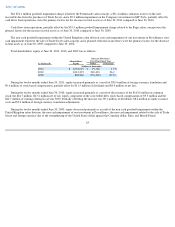
Hair Restoration Center Revenues. Total Hair Restoration Centers revenues were as follows:
The percentage increases (decreases) during the years ended June 30, 2011, 2010, and 2009 were due to the following factors:
We acquired four hair restoration centers during the twelve months ended June 30, 2011, all of which were franchise buybacks, and
constructed three hair restoration centers during the twelve months ended June 30, 2011. The increase in organic Hair Restoration Centers
revenues during fiscal year 2011 was due to the increase in same-store sales of 1.2 percent.
We constructed four hair restoration centers during the twelve months ended June 30, 2010. The increase in organic Hair Restoration
Centers revenues during fiscal year 2010 was due to the increase in same-store sales of 0.4 percent.
We acquired two hair restoration centers during the twelve months ended June 30, 2009, both of which were franchise buybacks, and
constructed eight hair restoration centers during the twelve months
60
Increase Over
Prior Fiscal Year
Same-Store
Sales
Increase
(Decrease)
Years Ended June 30,
Revenues
Dollar
Percentage
(Dollars in thousands)
2011
$
145,688
$
3,902
2.8
%
1.2
%
2010
141,786
1,266
0.9
0.4
2009
140,520
4,938
3.6
(0.8
)
Percentage Increase
(Decrease) in Revenues
For the Years Ended
June 30,
2011
2010
2009
Acquisitions (previous twelve months)
1.1
%
0.2
%
5.9
%
Organic
1.0
1.0
(0.9
)
Franchise revenues
0.7
(0.3
)
(1.4
)
2.8
%
0.9
%
3.6
%