Supercuts 2011 Annual Report Download - page 41
Download and view the complete annual report
Please find page 41 of the 2011 Supercuts annual report below. You can navigate through the pages in the report by either clicking on the pages listed below, or by using the keyword search tool below to find specific information within the annual report.-
 1
1 -
2
-
3
-
4
-
5
-
6
-
7
-
8
-
9
-
10
-
11
-
12
-
13
-
14
-
15
-
16
-
17
-
18
-
19
-
20
-
21
-
22
-
23
-
24
-
25
-
26
-
27
-
28
-
29
-
30
-
 31
31 -
 32
32 -
 33
33 -
 34
34 -
 35
35 -
 36
36 -
 37
37 -
 38
38 -
 39
39 -
 40
40 -
 41
41 -
 42
42 -
 43
43 -
 44
44 -
 45
45 -
 46
46 -
 47
47 -
 48
48 -
 49
49 -
 50
50 -
 51
51 -
52
-
53
-
54
-
55
-
56
-
57
-
58
-
59
-
60
-
61
-
62
-
63
-
64
-
65
-
66
-
67
-
68
-
69
-
70
-
71
-
72
-
73
-
74
-
75
-
76
-
77
-
78
-
79
-
80
-
81
-
82
-
83
-
84
-
85
-
86
-
87
-
88
-
89
-
90
-
91
-
92
-
93
-
94
-
95
-
96
-
97
-
98
-
99
-
100
-
101
-
102
-
103
-
104
-
105
-
106
-
107
-
108
-
109
-
110
-
111
-
112
-
113
-
114
-
115
-
116
-
117
-
118
-
119
-
120
-
121
-
122
-
123
-
124
-
125
-
126
-
127
-
128
-
129
-
130
-
131
-
132
-
133
-
134
-
135
-
136
-
137
-
138
-
139
-
140
-
141
-
142
-
143
-
144
-
145
-
146
-
147
-
148
-
149
-
150
-
151
-
152
-
153
-
154
-
155
-
156
-
157
-
158
-
159
-
160
-
161
-
162
-
163
-
164
-
165
-
166
-
167
-
168
-
169
-
170
-
171
-
172
-
173
-
174
-
175
-
176
-
177
-
178
 |
 |

Table of Contents
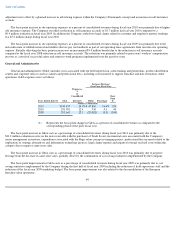
of the salon assets and the estimated fair value. The fair value estimate is based on the best information available, including market data.
Judgments made by management related to the expected useful lives of long-lived assets and the ability to realize undiscounted cash flows
in excess of the carrying amounts of such assets are affected by factors such as the ongoing maintenance and improvement of the assets, changes
in economic conditions and changes in operating performance. As the ongoing expected cash flows and carrying amounts of long-
lived assets are
assessed, these factors could cause us to realize material impairment charges.
During fiscal years 2011, 2010, and 2009, $6.7, $6.4, and $10.2 million, respectively, of impairment was recorded within depreciation and
amortization in the Consolidated Statement of Operations. In June 2009, we approved a plan to close up to 80 underperforming United Kingdom
company-owned salons in fiscal year 2010 that was in addition to the July 2008 approved plan of closing up to 160 underperforming company-
owned salons in fiscal year 2009. We also evaluated the appropriateness of the remaining useful lives of its affected property and equipment and
whether a change to the depreciation charge was warranted.
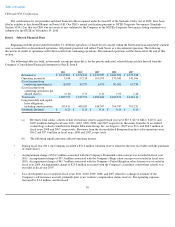
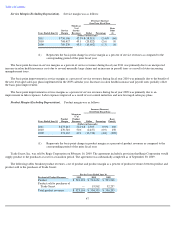
Purchase Price Allocation
We make numerous acquisitions. The purchase prices are allocated to assets acquired, including identifiable intangible assets, and liabilities
assumed based on their estimated fair values at the dates of acquisition. Fair value is estimated based on the amount for which the asset or
liability could be bought or sold in a current transaction between willing parties. For our acquisitions, the majority of the purchase price that is
not allocated to identifiable assets, or liabilities assumed, is accounted for as residual goodwill rather than identifiable intangible assets. This
stems from the value associated with the walk-in customer base of the acquired salons, the value of which is not recorded as an identifiable
intangible asset under current accounting guidance and the limited value of the acquired leased site and customer preference associated with the
acquired hair salon brand. Residual goodwill further represents our opportunity to strategically combine the acquired business with our existing
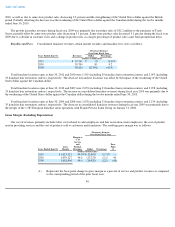
structure to serve a greater number of customers through our expansion strategies. Identifiable intangible assets purchased in fiscal year 2011,
2010, and 2009 acquisitions totaled $2.0, $0.1, and $1.3 million, respectively. The residual goodwill generated by fiscal year 2011, 2010, and
2009 acquisitions totaled $12.5, $2.6, and $30.8 million, respectively. See Note 4 to the Consolidated Financial Statements for further
information.
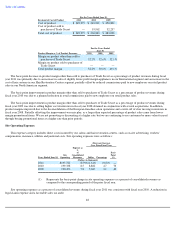
Self Insurance Accruals
The Company uses a combination of third party insurance and self-insurance for a number of risks including workers' compensation, health
insurance, employment practice liability and general liability claims. The liability represents the Company's estimate of the undiscounted
ultimate cost of uninsured claims incurred as of the balance sheet date.
The workers' compensation, general liability and employment practice liability analysis includes applying loss development factors to the
Company's historical claims data (total paid and incurred amounts per claim) for all policy years where the Company has not reached its
aggregate limits to project the future development of incurred claims. The workers' compensation analysis is performed for three models;
California, Texas and all other states. A variety of accepted actuarial methodologies are followed to determine these liabilities, including several
methods to predict the loss development factors for each policy period. These liabilities are determined by modeling the frequency (number of
claims) and severity (cost of claims), fitting statistical distributions to the experience, and then running simulations. A similar analysis is
performed for both general liability and employment practices liability;
39