Neiman Marcus 2010 Annual Report Download - page 66
Download and view the complete annual report
Please find page 66 of the 2010 Neiman Marcus annual report below. You can navigate through the pages in the report by either clicking on the pages listed below, or by using the keyword search tool below to find specific information within the annual report.-
 1
1 -
2
-
3
-
4
-
5
-
6
-
7
-
8
-
9
-
10
-
11
-
12
-
13
-
14
-
15
-
16
-
17
-
18
-
19
-
20
-
21
-
22
-
23
-
24
-
25
-
26
-
27
-
28
-
29
-
30
-
31
-
32
-
33
-
34
-
35
-
36
-
37
-
38
-
39
-
40
-
41
-
42
-
43
-
44
-
45
-
46
-
47
-
48
-
49
-
50
-
51
-
52
-
53
-
54
-
55
-
 56
56 -
 57
57 -
 58
58 -
 59
59 -
 60
60 -
 61
61 -
 62
62 -
 63
63 -
 64
64 -
 65
65 -
 66
66 -
 67
67 -
 68
68 -
 69
69 -
 70
70 -
 71
71 -
 72
72 -
 73
73 -
 74
74 -
 75
75 -
 76
76 -
77
-
78
-
79
-
80
-
81
-
82
-
83
-
84
-
85
-
86
-
87
-
88
-
89
-
90
-
91
-
92
-
93
-
94
-
95
-
96
-
97
-
98
-
99
-
100
-
101
-
102
-
103
-
104
-
105
-
106
-
107
-
108
-
109
-
110
-
111
-
112
-
113
-
114
-
115
-
116
-
117
-
118
-
119
-
120
-
121
-
122
-
123
-
124
-
125
-
126
-
127
-
128
-
129
-
130
-
131
-
132
-
133
-
134
-
135
-
136
-
137
-
138
-
139
-
140
-
141
-
142
-
143
-
144
-
145
-
146
-
147
-
148
-
149
-
150
-
151
-
152
-
153
-
154
-
155
-
156
-
157
-
158
-
159
-
160
-
161
-
162
-
163
-
164
-
165
-
166
-
167
-
168
-
169
-
170
-
171
-
172
-
173
-
174
-
175
-
176
-
177
-
178
-
179
-
180
-
181
-
182
-
183
-
184
-
185
 |
 |

Table of Contents
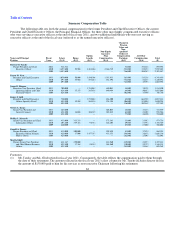
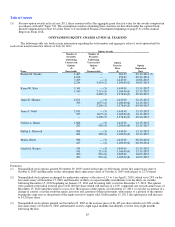
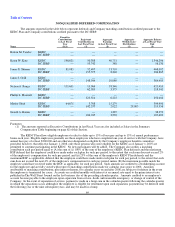
Summary Compensation Table
The following table sets forth the annual compensation for the former President and Chief Executive Officer, the current
President and Chief Executive Officer, the Principal Financial Officer, the three other most highly compensated executive officers
who were serving as executive officers at the end of fiscal year 2011, and two additional individuals who were not serving as
executive officers at the end of the fiscal year (referred to as the named executive officers).
Change in
Pension
Value and
Non-
Non-Equity qualified
Incentive Deferred
Option Plan Compensation All Other
Name and Principal Fiscal Salary Bonus Awards Compensation Earnings Compensation Total
Position Year ($)(1) ($)(2) ($)(3) ($)(4) ($)(5) ($)(6) ($)
Burton M. Tansky
Former President and Chief
Executive Officer
2011 512,542 — — — 32,000 351,416 895,958
2010 1,497,600 59,904 3,382,886 2,346,739 521,000 139,153 7,947,282
2009 1,497,600 — — — 786,000 108,287 2,391,887
Karen W. Katz
President and Chief Executive
Officer
2011 1,050,000 50,000 3,430,308 1,315,913 363,000 133,238 6,342,459
2010 897,600 35,904 531,615 851,598 752,000 52,237 3,120,954
2009 897,600 — — — 721,000 45,394 1,663,994
James E. Skinner
Executive Vice President, Chief
Operating Officer and Chief
Financial Officer
2011 700,000 — 1,755,041 650,081 38,000 70,978 3,214,100
2010 628,800 25,152 265,838 640,464 84,000 40,812 1,685,066
2009 628,800 — — — 102,000 35,980 766,780
James J. Gold
President and Chief Executive
Officer Specialty Retail
2011 750,000 — 1,755,041 826,200 42,000 664,592 4,037,833
2010 499,200 19,968 265,838 534,194 106,000 195,094 1,620,294
2009 499,200 — — — 116,000 202,189 817,389
Nelson A. Bangs
Senior Vice President and
General Counsel
2011 462,000 — — 208,085 28,000 33,474 731,559
2010 451,200 18,048 106,319 282,812 63,000 24,207 945,586
2009 451,200 — — — 77,000 26,490 554,690
Phillip L. Maxwell
Senior Vice President and Chief
Information Officer
2011 412,000 333,333 — 172,381 33,000 23,012 973,726
2010 403,200 349,461 98,354 248,403 69,000 23,951 1,192,369
2009 420,000 — — — 83,000 23,080 526,080
Gerald A. Barnes
Former President and Chief
Executive Officer Neiman
Marcus Direct
2011 435,000 200,000 — 109,829 83,000 37,125 864,954
2010 425,000 17,000 1,457,351 422,153 298,000 26,832 2,646,336
2009 425,000 — — — 282,000 25,041 732,041
Marita Glodt
Former Senior Vice President
and Chief Human Resource
Officer
2011 431,187 250,000 — 212,960 439,000 23,971 1,357,118
2010 429,100 17,164 98,354 268,960 310,000 22,753 1,146,331
2009 429,100 — — — 245,000 24,162 698,262
Footnotes:
(1)
Mr. Tansky and Ms. Glodt retired in fiscal year 2011. Consequently, the table reflects the compensation paid to them through
the date of their retirement. The amount reflected in the fiscal year 2011 salary column for Mr. Tansky includes director fees in
the amount of $150,000 paid to him for his services as non-executive Chairman following his retirement.
62