Neiman Marcus 2010 Annual Report Download - page 122
Download and view the complete annual report
Please find page 122 of the 2010 Neiman Marcus annual report below. You can navigate through the pages in the report by either clicking on the pages listed below, or by using the keyword search tool below to find specific information within the annual report.-
 1
1 -
2
-
3
-
4
-
5
-
6
-
7
-
8
-
9
-
10
-
11
-
12
-
13
-
14
-
15
-
16
-
17
-
18
-
19
-
20
-
21
-
22
-
23
-
24
-
25
-
26
-
27
-
28
-
29
-
30
-
31
-
32
-
33
-
34
-
35
-
36
-
37
-
38
-
39
-
40
-
41
-
42
-
43
-
44
-
45
-
46
-
47
-
48
-
49
-
50
-
51
-
52
-
53
-
54
-
55
-
56
-
57
-
58
-
59
-
60
-
61
-
62
-
63
-
64
-
65
-
66
-
67
-
68
-
69
-
70
-
71
-
72
-
73
-
74
-
75
-
76
-
77
-
78
-
79
-
80
-
81
-
82
-
83
-
84
-
85
-
86
-
87
-
88
-
89
-
90
-
91
-
92
-
93
-
94
-
95
-
96
-
97
-
98
-
99
-
100
-
101
-
102
-
103
-
104
-
105
-
106
-
107
-
108
-
109
-
110
-
111
-
 112
112 -
 113
113 -
 114
114 -
 115
115 -
 116
116 -
 117
117 -
 118
118 -
 119
119 -
 120
120 -
 121
121 -
 122
122 -
 123
123 -
 124
124 -
 125
125 -
 126
126 -
 127
127 -
 128
128 -
 129
129 -
 130
130 -
 131
131 -
 132
132 -
133
-
134
-
135
-
136
-
137
-
138
-
139
-
140
-
141
-
142
-
143
-
144
-
145
-
146
-
147
-
148
-
149
-
150
-
151
-
152
-
153
-
154
-
155
-
156
-
157
-
158
-
159
-
160
-
161
-
162
-
163
-
164
-
165
-
166
-
167
-
168
-
169
-
170
-
171
-
172
-
173
-
174
-
175
-
176
-
177
-
178
-
179
-
180
-
181
-
182
-
183
-
184
-
185
 |
 |

Table of Contents
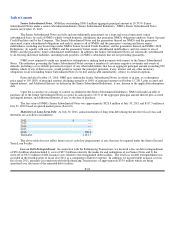
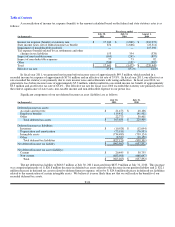
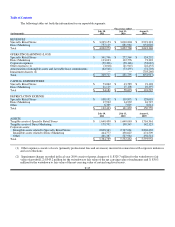
Costs of Benefits. The components of the expenses we incurred under our Pension Plan, SERP Plan and Postretirement Plan
are as follows:
Fiscal year ended
(in thousands)
July 30,
2011
July 31,
2010
August 1,
2009
Pension Plan:
Service cost $ — $ 5,687 $ 6,057
Interest cost 24,215 25,230 24,361
Expected return on plan assets (26,210) (26,340) (26,048)
Net amortization of losses 2,176 752 —
Pension Plan expense $ 181 $ 5,329 $ 4,370
SERP Plan:
Service cost $ — $ 680 $ 689
Interest cost 4,919 5,399 5,312
SERP Plan expense $ 4,919 $ 6,079 $ 6,001
Curtailment gain $ — $ 1,479 $ —
Postretirement Plan:
Service cost $ 61 $ 72 $ 92
Interest cost 871 1,017 1,343
Net amortization of prior service credit (1,556) (686) —
Net amortization of losses 690 358 282
Postretirement Plan expense $ 66 $ 761 $ 1,717
For purposes of determining pension expense, the expected return on plan assets is calculated using the market related value
of plan assets. The market related value of plan assets does not immediately recognize realized gains and losses. Rather, these effects
of realized gains and losses are deferred initially and amortized over three years in the determination of the market related value of
plan assets. At July 30, 2011, the fair value of plan assets exceeded the market related value by $12.8 million.
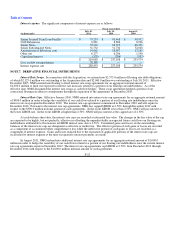
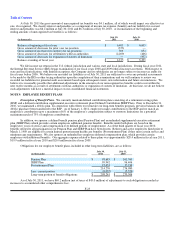
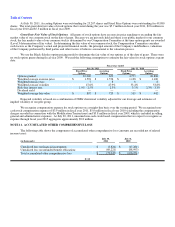
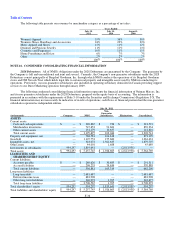
Benefit Obligations. Our obligations for the Pension Plan, SERP Plan and Postretirement Plan are valued annually as of the
end of each fiscal year. Changes in our obligations pursuant to our Pension Plan, SERP Plan and Postretirement Plan during fiscal
years 2011 and 2010 are as follows:
Pension Plan SERP Plan Postretirement Plan
Fiscal years Fiscal years Fiscal years
(in thousands) 2011 2010 2011 2010 2011 2010
Projected benefit obligations:
Beginning of year $ 476,226 $ 427,995 $ 96,406 $ 92,152 $ 17,914 $ 17,920
Service cost — 5,687 — 680 61 72
Interest cost 24,215 25,230 4,919 5,399 871 1,017
Actuarial (gain) loss (10,026) 48,041 2,153 9,206 (2,335) 3,382
Curtailment — (16,606) — (8,426) — —
Plan amendments — — — — — (3,359)
Benefits paid, net (15,363)(14,121)(3,536)(2,605)(860)(1,118)
End of year $ 475,052 $ 476,226 $ 99,942 $ 96,406 $ 15,651 $ 17,914
In connection with the actions in the third quarter of fiscal year 2010 to freeze benefits offered under our Pension Plan and
SERP Plan, we recognized a gain of $25.0 million. Of the aggregate gain, $23.5 million was recorded as a reduction of accumulated
other comprehensive loss and $1.5 million was recorded as a curtailment gain.
F-26