Neiman Marcus 2010 Annual Report Download - page 62
Download and view the complete annual report
Please find page 62 of the 2010 Neiman Marcus annual report below. You can navigate through the pages in the report by either clicking on the pages listed below, or by using the keyword search tool below to find specific information within the annual report.-
 1
1 -
2
-
3
-
4
-
5
-
6
-
7
-
8
-
9
-
10
-
11
-
12
-
13
-
14
-
15
-
16
-
17
-
18
-
19
-
20
-
21
-
22
-
23
-
24
-
25
-
26
-
27
-
28
-
29
-
30
-
31
-
32
-
33
-
34
-
35
-
36
-
37
-
38
-
39
-
40
-
41
-
42
-
43
-
44
-
45
-
46
-
47
-
48
-
49
-
50
-
51
-
 52
52 -
 53
53 -
 54
54 -
 55
55 -
 56
56 -
 57
57 -
 58
58 -
 59
59 -
 60
60 -
 61
61 -
 62
62 -
 63
63 -
 64
64 -
 65
65 -
 66
66 -
 67
67 -
 68
68 -
 69
69 -
 70
70 -
 71
71 -
 72
72 -
73
-
74
-
75
-
76
-
77
-
78
-
79
-
80
-
81
-
82
-
83
-
84
-
85
-
86
-
87
-
88
-
89
-
90
-
91
-
92
-
93
-
94
-
95
-
96
-
97
-
98
-
99
-
100
-
101
-
102
-
103
-
104
-
105
-
106
-
107
-
108
-
109
-
110
-
111
-
112
-
113
-
114
-
115
-
116
-
117
-
118
-
119
-
120
-
121
-
122
-
123
-
124
-
125
-
126
-
127
-
128
-
129
-
130
-
131
-
132
-
133
-
134
-
135
-
136
-
137
-
138
-
139
-
140
-
141
-
142
-
143
-
144
-
145
-
146
-
147
-
148
-
149
-
150
-
151
-
152
-
153
-
154
-
155
-
156
-
157
-
158
-
159
-
160
-
161
-
162
-
163
-
164
-
165
-
166
-
167
-
168
-
169
-
170
-
171
-
172
-
173
-
174
-
175
-
176
-
177
-
178
-
179
-
180
-
181
-
182
-
183
-
184
-
185
 |
 |

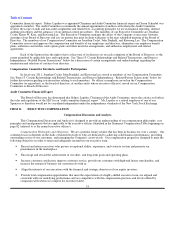
Table of Contents
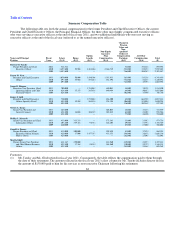
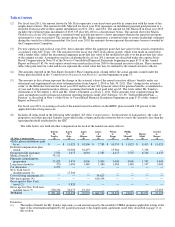
compensation paid to our named executive officers. Fiscal year 2011 target annual incentives and relative performance weights for
the named executive officers were as follows:
Target Bonus
As Percent of Relative Performance Weights
Name Base Salary Company Division
Karen W. Katz 100% 100% —
James E. Skinner 75% 100% —
James J. Gold 75% 40% 60%
Nelson A. Bangs 40% 100% —
Phillip L. Maxwell 40% 100% —
Marita Glodt 40% 100% —
Gerald A. Barnes 60% 40% 60%
Ms. Katz, the individual with the greatest overall responsibility for company performance, was granted a larger incentive
opportunity in comparison to her base salary in order to weight her annual cash compensation mix more heavily towards performance-
based compensation. Since Mr. Barnes and Mr. Gold each have responsibility over a particular division, performance goals are more
heavily weighted toward the operational performance of their respective division.
Bonus related to Employment Agreement. Ms. Katz received a one-time bonus in the amount of $50,000 pursuant to the
terms of her employment agreement payable thirty-days following the effective date of assuming the position of President and Chief
Executive Officer.
Corporate Performance Targets. At the end of the fiscal year, the Compensation Committee evaluates Company's
performance against the financial and strategic performance targets set at the beginning of the fiscal year. For fiscal year 2011, the
bonus metrics and relative weights for Ms. Katz and Ms. Glodt, and Messrs. Skinner, Bangs, and Maxwell, were based on the overall
EBITDA, sales and ROIC; for Mr. Gold, overall EBITDA, sales, and GMROI at Neiman Marcus Stores and Bergdorf Goodman, and
for Mr. Barnes, EBITDA, sales, conversion, and traffic/number of visitors at Neiman Marcus Direct. Metrics used for each executive
are based on strategic business drivers of the particular business unit or division that the executive manages. The bonus metrics
related to threshold, target and maximum annual incentive bonus payouts for fiscal year 2011, as well as actual amounts achieved and
actual payout percentages for fiscal year 2011, are as follows:
Threshold Target Maximum Achieved
Payout
As
Percent
of Target
Neiman Marcus Group
Sales (in millions) $ 3,816 $ 3,959 $ 4,182 $ 4,002 119.4%
EBITDA (in millions) $ 463 $ 510 $ 580 $ 525 121.0%
ROIC 24.12% 27.52% 32.52% 30.18% 153.2%
Specialty Retail
Sales (in millions) $ 2,870 $ 2,964 $ 3,116 $ 3,034 146.1%
EBITDA (in millions) $ 376 $ 408 $ 458 $ 430 144.0%
GMROI 2.023% 2.060% 2.117% 2.120% 200.0%
Neiman Marcus Direct
Sales (in millions) $ 709 $ 749 $ 797 $ 738 78.6%
EBITDA (in millions) $ 134 $ 146 $ 163 $ 131 0.0%
Conversion 3.30 3.37 3.50 3.25 0.0%
Traffic/Visitors (in millions) 53.9 57.1 59.1 56.24 79.8%
For purposes of evaluating performance and annual incentive compensation, the ROIC metric is calculated by dividing 1)
earnings before interest and taxes by 2) average invested capital excluding cash, accrued interest, deferred taxes and amounts related
to financial derivatives and is used to assess our efficiency at turning capital into profitable investments. The GMROI is calculated by
dividing the gross margin by the average inventory cost. Conversion is the percentage of visitors to the site who make a purchase.
58