Neiman Marcus 2010 Annual Report Download - page 31
Download and view the complete annual report
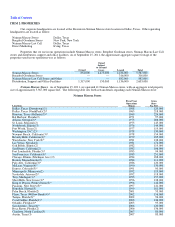
Please find page 31 of the 2010 Neiman Marcus annual report below. You can navigate through the pages in the report by either clicking on the pages listed below, or by using the keyword search tool below to find specific information within the annual report.-
 1
1 -
2
-
3
-
4
-
5
-
6
-
7
-
8
-
9
-
10
-
11
-
12
-
13
-
14
-
15
-
16
-
17
-
18
-
19
-
20
-
 21
21 -
 22
22 -
 23
23 -
 24
24 -
 25
25 -
 26
26 -
 27
27 -
 28
28 -
 29
29 -
 30
30 -
 31
31 -
 32
32 -
 33
33 -
 34
34 -
 35
35 -
 36
36 -
 37
37 -
 38
38 -
 39
39 -
 40
40 -
 41
41 -
42
-
43
-
44
-
45
-
46
-
47
-
48
-
49
-
50
-
51
-
52
-
53
-
54
-
55
-
56
-
57
-
58
-
59
-
60
-
61
-
62
-
63
-
64
-
65
-
66
-
67
-
68
-
69
-
70
-
71
-
72
-
73
-
74
-
75
-
76
-
77
-
78
-
79
-
80
-
81
-
82
-
83
-
84
-
85
-
86
-
87
-
88
-
89
-
90
-
91
-
92
-
93
-
94
-
95
-
96
-
97
-
98
-
99
-
100
-
101
-
102
-
103
-
104
-
105
-
106
-
107
-
108
-
109
-
110
-
111
-
112
-
113
-
114
-
115
-
116
-
117
-
118
-
119
-
120
-
121
-
122
-
123
-
124
-
125
-
126
-
127
-
128
-
129
-
130
-
131
-
132
-
133
-
134
-
135
-
136
-
137
-
138
-
139
-
140
-
141
-
142
-
143
-
144
-
145
-
146
-
147
-
148
-
149
-
150
-
151
-
152
-
153
-
154
-
155
-
156
-
157
-
158
-
159
-
160
-
161
-
162
-
163
-
164
-
165
-
166
-
167
-
168
-
169
-
170
-
171
-
172
-
173
-
174
-
175
-
176
-
177
-
178
-
179
-
180
-
181
-
182
-
183
-
184
-
185
 |
 |

Table of Contents
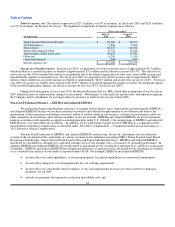
• Occupancy costs—Occupancy costs consist primarily of rent, property taxes and operating costs of our retail,
distribution and support facilities. A significant portion of our buying and occupancy costs are fixed in nature and are
not dependent on the revenues we generate.
• Delivery and processing costs—Delivery and processing costs consist primarily of delivery charges we pay to third-
party carriers and other costs related to the fulfillment of customer orders not delivered at the point-of-sale.
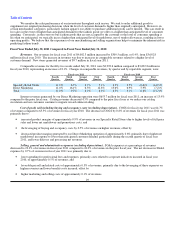
Consistent with industry business practice, we receive allowances from certain of our vendors in support of the merchandise
we purchase for resale. Certain allowances are received to reimburse us for markdowns taken or to support the gross margins that we
earn in connection with the sales of the vendor's merchandise. These allowances result in an increase to gross margin when we earn
the allowances and they are approved by the vendor. Other allowances we receive represent reductions to the amounts we pay to
acquire the merchandise. These allowances reduce the cost of the acquired merchandise and are recognized at the time the goods are
sold. We received vendor allowances of $87.5 million, or 2.2% of revenues, in fiscal year 2011, $81.2 million, or 2.2% of revenues,
in fiscal year 2010 and $107.7 million, or 3.0% of revenues, in fiscal year 2009. The amounts of vendor allowances we receive
fluctuate based on the level of markdowns taken and did not have a significant impact on the year-over-year change in gross margin
during fiscal years 2011, 2010 or 2009.
Changes in our COGS as a percentage of revenues can be affected by the following factors:
• our ability to order an appropriate amount of merchandise to match customer demand and the related impact on the level
of net markdowns and promotions costs incurred;
• customer acceptance of and demand for the merchandise we offer in a given season and the related impact of such
factors on the level of full-price sales;
• factors affecting revenues generally, including pricing and promotional strategies, product offerings and other actions
taken by competitors;
• changes in occupancy costs primarily associated with the opening of new stores or distribution facilities; and
• the amount of vendor reimbursements we receive during the fiscal year.
Selling, general and administrative expenses (excluding depreciation). SG&A principally consists of costs related to
employee compensation and benefits in the selling and administrative support areas and advertising and marketing costs. A
significant portion of our selling, general and administrative expenses are variable in nature and are dependent on the revenues we
generate.
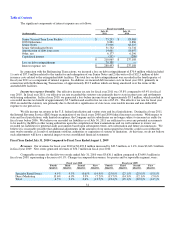
Advertising costs consist primarily of 1) print media costs for promotional materials mailed to our customers, 2) advertising
costs incurred related to the production, printing and distribution of our print catalogs and the production of the photographic content
for our websites and 3) online marketing costs. We receive advertising allowances from certain of our merchandise vendors.
Substantially all the advertising allowances we receive represent reimbursements of direct, specific and incremental costs that we
incur to promote the vendor's merchandise in connection with our various advertising programs, primarily catalogs and other print
media. Advertising allowances fluctuate based on the level of advertising expenses incurred and are recorded as a reduction of our
advertising costs when earned. Advertising allowances aggregated approximately $49.3 million, or 1.2% of revenues, in fiscal year
2011, $46.2 million, or 1.3% of revenues, in fiscal year 2010 and $65.7 million, or 1.8% of revenues, in fiscal year 2009.
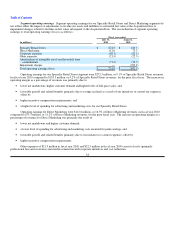
We also receive allowances from certain merchandise vendors in conjunction with compensation programs for employees
who sell the vendor's merchandise. These allowances are netted against the related compensation expense that we incur. Amounts
received from vendors related to compensation programs were $60.3 million, or 1.5% of revenues, in fiscal year 2011, $61.1 million,
or 1.7% of revenues, in fiscal year 2010 and $65.8 million, or 1.8% of revenues, in fiscal year 2009.
Changes in our selling, general and administrative expenses are affected primarily by the following factors:
• changes in the number of sales associates primarily due to new store openings and expansion of existing stores,
including increased health care and related benefits expenses;
• changes in expenses incurred in connection with our advertising and marketing programs; and
27