Neiman Marcus 2010 Annual Report Download - page 106
Download and view the complete annual report
Please find page 106 of the 2010 Neiman Marcus annual report below. You can navigate through the pages in the report by either clicking on the pages listed below, or by using the keyword search tool below to find specific information within the annual report.-
 1
1 -
2
-
3
-
4
-
5
-
6
-
7
-
8
-
9
-
10
-
11
-
12
-
13
-
14
-
15
-
16
-
17
-
18
-
19
-
20
-
21
-
22
-
23
-
24
-
25
-
26
-
27
-
28
-
29
-
30
-
31
-
32
-
33
-
34
-
35
-
36
-
37
-
38
-
39
-
40
-
41
-
42
-
43
-
44
-
45
-
46
-
47
-
48
-
49
-
50
-
51
-
52
-
53
-
54
-
55
-
56
-
57
-
58
-
59
-
60
-
61
-
62
-
63
-
64
-
65
-
66
-
67
-
68
-
69
-
70
-
71
-
72
-
73
-
74
-
75
-
76
-
77
-
78
-
79
-
80
-
81
-
82
-
83
-
84
-
85
-
86
-
87
-
88
-
89
-
90
-
91
-
92
-
93
-
94
-
95
-
 96
96 -
 97
97 -
 98
98 -
 99
99 -
 100
100 -
 101
101 -
 102
102 -
 103
103 -
 104
104 -
 105
105 -
 106
106 -
 107
107 -
 108
108 -
 109
109 -
 110
110 -
 111
111 -
 112
112 -
 113
113 -
 114
114 -
 115
115 -
 116
116 -
117
-
118
-
119
-
120
-
121
-
122
-
123
-
124
-
125
-
126
-
127
-
128
-
129
-
130
-
131
-
132
-
133
-
134
-
135
-
136
-
137
-
138
-
139
-
140
-
141
-
142
-
143
-
144
-
145
-
146
-
147
-
148
-
149
-
150
-
151
-
152
-
153
-
154
-
155
-
156
-
157
-
158
-
159
-
160
-
161
-
162
-
163
-
164
-
165
-
166
-
167
-
168
-
169
-
170
-
171
-
172
-
173
-
174
-
175
-
176
-
177
-
178
-
179
-
180
-
181
-
182
-
183
-
184
-
185
 |
 |

Table of Contents
• Level 3 — valuation inputs are unobservable and typically reflect management's estimates of assumptions that market
participants would use in pricing the asset or liability. The fair values are therefore determined using model-based techniques
that include option pricing models, discounted cash flow models and similar techniques.
At July 30, 2011 and July 31, 2010, the fair values of cash and cash equivalents, receivables and accounts payable
approximated their carrying values due to the short-term nature of these instruments. See Notes 6, 7 and 9 of the Notes to
Consolidated Financial Statements for the estimated fair values of our long-term debt, derivative financial instruments and Pension
Plan investments.
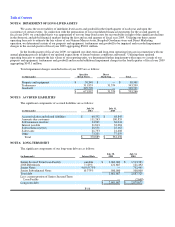
Derivative Financial Instruments. In connection with the Acquisition, we entered into $2,575.0 million of floating rate debt
obligations, of which $2,125.0 million was outstanding at the Acquisition date and $2,060.0 million was outstanding at July 30, 2011.
As a result, we entered into derivative financial instruments, primarily interest rate cap agreements, to hedge the variability of our cash
flows related to a portion of our floating rate indebtedness. The derivative financial instruments are included in assets or liabilities in
our consolidated balance sheets and are recorded at estimated fair value at each balance sheet date.
Cash and Cash Equivalents. Cash and cash equivalents primarily consist of cash on hand in our stores, deposits with banks
and overnight investments with banks and financial institutions. Cash equivalents are stated at cost, which approximates fair value.
Our cash management system provides for the reimbursement of all major bank disbursement accounts on a daily basis. Accounts
payable includes outstanding checks not yet presented for payment of $41.8 million at July 30, 2011 and $35.8 million at July 31,
2010.
Merchandise Inventories and Cost of Goods Sold. We utilize the retail method of accounting. Under the retail inventory
method, the valuation of inventories at cost and the resulting gross margins are determined by applying a calculated cost-to-retail ratio,
for various groupings of similar items, to the retail value of our inventories. The cost of the inventory reflected on the consolidated
balance sheets is decreased by charges to cost of goods sold at the time the retail value of the inventory is lowered through the use of
markdowns. Earnings are negatively impacted when merchandise is marked down. As we adjust the retail value of our inventories
through the use of markdowns to reflect market conditions, our merchandise inventories are stated at the lower of cost or market.
The areas requiring significant management judgment related to the valuation of our inventories include 1) setting the
original retail value for the merchandise held for sale, 2) recognizing merchandise for which the customer's perception of value has
declined and appropriately marking the retail value of the merchandise down to the perceived value and 3) estimating the shrinkage
that has occurred between physical inventory counts. These judgments and estimates, coupled with the averaging processes within the
retail method can, under certain circumstances, produce varying financial results. Factors that can lead to different financial results
include 1) determination of original retail values for merchandise held for sale, 2) identification of declines in perceived value of
inventories and processing the appropriate retail value markdowns and 3) overly optimistic or conservative estimation of shrinkage. In
prior years, we have not made material changes to our estimates of shrinkage or markdown requirements on inventories held as of the
end of our fiscal years.
Consistent with industry business practice, we receive allowances from certain of our vendors in support of the merchandise
we purchase for resale. Certain allowances are received to reimburse us for markdowns taken or to support the gross margins that we
earn in connection with the sales of the vendor's merchandise. These allowances result in an increase to gross margin when we earn
the allowances and they are approved by the vendor. Other allowances we receive represent reductions to the amounts we pay to
acquire the merchandise. These allowances reduce the cost of the acquired merchandise and are recognized at the time the goods are
sold. The amounts of vendor allowances we receive fluctuate based on the level of markdowns taken and did not have a significant
impact on the year-over-year change in gross margin during fiscal years 2011, 2010 or 2009. We received vendor allowances of
$87.5 million, or 2.2% of revenues, in fiscal year 2011, $81.2 million, or 2.2% of revenues, in fiscal year 2010 and $107.7 million, or
3.0% of revenues, in fiscal year 2009.
We obtain certain merchandise, primarily precious jewelry, on a consignment basis in order to expand our product
assortment. Consignment merchandise held by us with a cost basis of $287.7 million at July 30, 2011 and $256.2 million at July 31,
2010 is not reflected in our consolidated balance sheets.
Cost of goods sold also includes delivery charges we pay to third-party carriers and other costs related to the fulfillment of
customer orders not delivered at the point-of-sale.
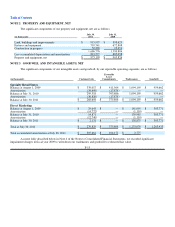
Long-lived Assets. Property and equipment are stated at cost less accumulated depreciation. For financial reporting purposes,
we compute depreciation principally using the straight-line method over the estimated useful lives of the assets.
F-10