Neiman Marcus 2010 Annual Report Download - page 119
Download and view the complete annual report
Please find page 119 of the 2010 Neiman Marcus annual report below. You can navigate through the pages in the report by either clicking on the pages listed below, or by using the keyword search tool below to find specific information within the annual report.-
 1
1 -
2
-
3
-
4
-
5
-
6
-
7
-
8
-
9
-
10
-
11
-
12
-
13
-
14
-
15
-
16
-
17
-
18
-
19
-
20
-
21
-
22
-
23
-
24
-
25
-
26
-
27
-
28
-
29
-
30
-
31
-
32
-
33
-
34
-
35
-
36
-
37
-
38
-
39
-
40
-
41
-
42
-
43
-
44
-
45
-
46
-
47
-
48
-
49
-
50
-
51
-
52
-
53
-
54
-
55
-
56
-
57
-
58
-
59
-
60
-
61
-
62
-
63
-
64
-
65
-
66
-
67
-
68
-
69
-
70
-
71
-
72
-
73
-
74
-
75
-
76
-
77
-
78
-
79
-
80
-
81
-
82
-
83
-
84
-
85
-
86
-
87
-
88
-
89
-
90
-
91
-
92
-
93
-
94
-
95
-
96
-
97
-
98
-
99
-
100
-
101
-
102
-
103
-
104
-
105
-
106
-
107
-
108
-
 109
109 -
 110
110 -
 111
111 -
 112
112 -
 113
113 -
 114
114 -
 115
115 -
 116
116 -
 117
117 -
 118
118 -
 119
119 -
 120
120 -
 121
121 -
 122
122 -
 123
123 -
 124
124 -
 125
125 -
 126
126 -
 127
127 -
 128
128 -
 129
129 -
130
-
131
-
132
-
133
-
134
-
135
-
136
-
137
-
138
-
139
-
140
-
141
-
142
-
143
-
144
-
145
-
146
-
147
-
148
-
149
-
150
-
151
-
152
-
153
-
154
-
155
-
156
-
157
-
158
-
159
-
160
-
161
-
162
-
163
-
164
-
165
-
166
-
167
-
168
-
169
-
170
-
171
-
172
-
173
-
174
-
175
-
176
-
177
-
178
-
179
-
180
-
181
-
182
-
183
-
184
-
185
 |
 |

Table of Contents
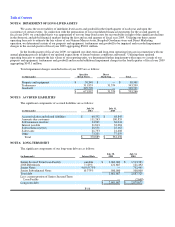
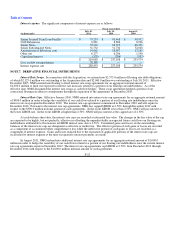
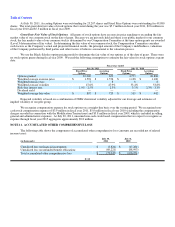
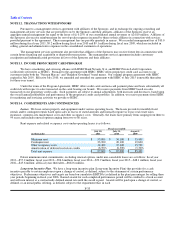
Fair Value. The fair values of the interest rate swaps and interest rate caps are estimated using industry standard valuation
models using market-based observable inputs, including interest rate curves (Level 2). A summary of the recorded assets (liabilities)
with respect to our derivative financial instruments included in our consolidated balance sheets is as follows:
(in thousands)
July 30,
2011
July 31,
2010
Interest rate caps (included in other long-term assets) $ 76 $ 1,040
Interest rate swaps (included in other current liabilities) $ — $ (22,661)
Accumulated other comprehensive loss, net of taxes $ 3,824 $ 17,281
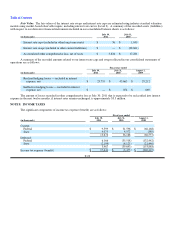
A summary of the recorded amounts related to our interest rate caps and swaps reflected in our consolidated statements of
operations are as follows:
Fiscal year ended
(in thousands)
July 30,
2011
July 31,
2010
August 1,
2009
Realized hedging losses — included in interest
expense, net $ 23,755 $ 45,663 $ 29,212
Ineffective hedging losses — included in interest
expense, net $ — $ 854 $ 669
The amount of losses recorded in other comprehensive loss at July 30, 2011 that is expected to be reclassified into interest
expense in the next twelve months, if interest rates remain unchanged, is approximately $3.3 million.
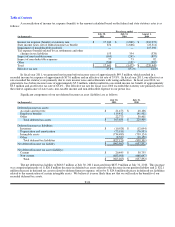
NOTE 8. INCOME TAXES
The significant components of income tax expense (benefit) are as follows:
Fiscal year ended
(in thousands)
July 30,
2011
July 31,
2010
August 1,
2009
Current:
Federal $ 9,599 $ 31,596 $ (66,168)
State 4,075 4,572 (389)
13,674 36,168 (66,557)
Deferred:
Federal 6,166 (35,518) (132,442)
State (2,199)(4,125)(21,446)
3,967 (39,643)(153,888)
Income tax expense (benefit) $ 17,641 $ (3,475)$ (220,445)
F-23