Neiman Marcus 2010 Annual Report Download - page 123
Download and view the complete annual report
Please find page 123 of the 2010 Neiman Marcus annual report below. You can navigate through the pages in the report by either clicking on the pages listed below, or by using the keyword search tool below to find specific information within the annual report.-
 1
1 -
2
-
3
-
4
-
5
-
6
-
7
-
8
-
9
-
10
-
11
-
12
-
13
-
14
-
15
-
16
-
17
-
18
-
19
-
20
-
21
-
22
-
23
-
24
-
25
-
26
-
27
-
28
-
29
-
30
-
31
-
32
-
33
-
34
-
35
-
36
-
37
-
38
-
39
-
40
-
41
-
42
-
43
-
44
-
45
-
46
-
47
-
48
-
49
-
50
-
51
-
52
-
53
-
54
-
55
-
56
-
57
-
58
-
59
-
60
-
61
-
62
-
63
-
64
-
65
-
66
-
67
-
68
-
69
-
70
-
71
-
72
-
73
-
74
-
75
-
76
-
77
-
78
-
79
-
80
-
81
-
82
-
83
-
84
-
85
-
86
-
87
-
88
-
89
-
90
-
91
-
92
-
93
-
94
-
95
-
96
-
97
-
98
-
99
-
100
-
101
-
102
-
103
-
104
-
105
-
106
-
107
-
108
-
109
-
110
-
111
-
112
-
 113
113 -
 114
114 -
 115
115 -
 116
116 -
 117
117 -
 118
118 -
 119
119 -
 120
120 -
 121
121 -
 122
122 -
 123
123 -
 124
124 -
 125
125 -
 126
126 -
 127
127 -
 128
128 -
 129
129 -
 130
130 -
 131
131 -
 132
132 -
 133
133 -
134
-
135
-
136
-
137
-
138
-
139
-
140
-
141
-
142
-
143
-
144
-
145
-
146
-
147
-
148
-
149
-
150
-
151
-
152
-
153
-
154
-
155
-
156
-
157
-
158
-
159
-
160
-
161
-
162
-
163
-
164
-
165
-
166
-
167
-
168
-
169
-
170
-
171
-
172
-
173
-
174
-
175
-
176
-
177
-
178
-
179
-
180
-
181
-
182
-
183
-
184
-
185
 |
 |

Table of Contents
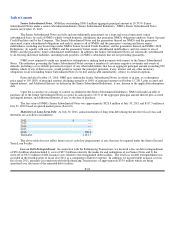
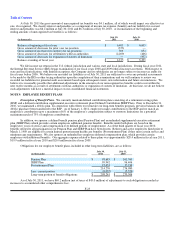
A summary of expected benefit payments related to our Pension Plan, SERP Plan and Postretirement Plan is as follows:
(in thousands)
Pension
Plan
SERP
Plan
Postretirement
Plan
Fiscal year 2012 $ 16,913 $ 5,228 $ 807
Fiscal year 2013 18,483 5,593 851
Fiscal year 2014 20,075 5,987 852
Fiscal year 2015 21,642 6,175 870
Fiscal year 2016 23,178 6,327 903
Fiscal years 2017-2021 135,345 35,282 5,292
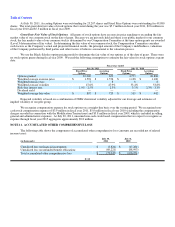
Funding Policy and Status. Our policy is to fund the Pension Plan at or above the minimum required by law. In fiscal years
2011 and 2010, we were not required to make contributions to the Pension Plan; however, we made voluntary contributions to our
Pension Plan of $30.0 million in each of fiscal years 2011 and 2010. As of July 30, 2011, we do not believe we will be required to
make contributions to the Pension Plan for fiscal year 2012. We will continue to evaluate voluntary contributions to our Pension Plan
based upon the unfunded position of the Pension Plan, our available liquidity and other factors.
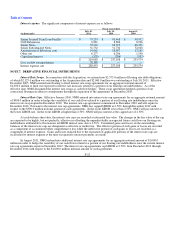
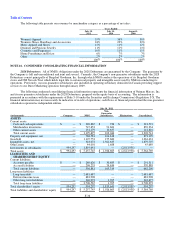
The funded status of our Pension Plan, SERP Plan and Postretirement Plan is as follows:
Pension Plan SERP Plan Postretirement Plan
Fiscal years Fiscal years Fiscal years
(in thousands) 2011 2010 2011 2010 2011 2010
Projected benefit obligation $ 475,052 $ 476,226 $ 99,942 $ 96,406 $ 15,651 $ 17,914
Fair value of plan assets 376,369 314,466 — — — —
Accrued obligation $ (98,683)$ (161,760)$ (99,942)$ (96,406)$ (15,651)$ (17,914)
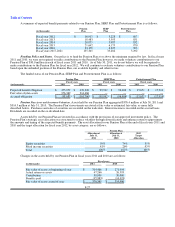
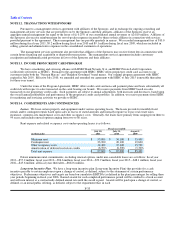
Pension Plan Assets and Investment Valuations. Assets held by our Pension Plan aggregated $376.4 million at July 30, 2011 and
$314.5 million at July 31, 2010. The Pension Plan's investments are stated at fair value or estimated fair value, as more fully
described below. Purchases and sales of securities are recorded on the trade date. Interest income is recorded on the accrual basis.
Dividends are recorded on the ex-dividend date.
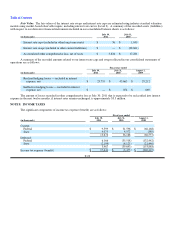
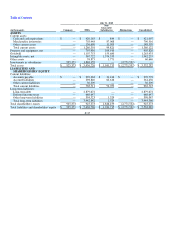
Assets held by our Pension Plan are invested in accordance with the provisions of our approved investment policy. The
Pension Plan's strategic asset allocation was structured to reduce volatility through diversification and enhance return to approximate
the amounts and timing of the expected benefit payments. The asset allocation for our Pension Plan at the end of fiscal years 2011 and
2010 and the target allocation for fiscal year 2012, by asset category, are as follows:
Pension Plan
Allocation at
July 31,
2011
Allocation at
July 31,
2010
2012
Target
Allocation
Equity securities 59% 74% 55%
Fixed income securities 41%26%45%
Total 100%100%100%
Changes in the assets held by our Pension Plan in fiscal years 2011 and 2010 are as follows:
Fiscal years
(in thousands) 2011 2010
Fair value of assets at beginning of year $ 314,466 $ 271,994
Actual return on assets 47,266 26,593
Contribution 30,000 30,000
Benefits paid (15,363)(14,121)
Fair value of assets at end of year $ 376,369 $ 314,466
F-27