Neiman Marcus 2010 Annual Report Download - page 128
Download and view the complete annual report
Please find page 128 of the 2010 Neiman Marcus annual report below. You can navigate through the pages in the report by either clicking on the pages listed below, or by using the keyword search tool below to find specific information within the annual report.-
 1
1 -
2
-
3
-
4
-
5
-
6
-
7
-
8
-
9
-
10
-
11
-
12
-
13
-
14
-
15
-
16
-
17
-
18
-
19
-
20
-
21
-
22
-
23
-
24
-
25
-
26
-
27
-
28
-
29
-
30
-
31
-
32
-
33
-
34
-
35
-
36
-
37
-
38
-
39
-
40
-
41
-
42
-
43
-
44
-
45
-
46
-
47
-
48
-
49
-
50
-
51
-
52
-
53
-
54
-
55
-
56
-
57
-
58
-
59
-
60
-
61
-
62
-
63
-
64
-
65
-
66
-
67
-
68
-
69
-
70
-
71
-
72
-
73
-
74
-
75
-
76
-
77
-
78
-
79
-
80
-
81
-
82
-
83
-
84
-
85
-
86
-
87
-
88
-
89
-
90
-
91
-
92
-
93
-
94
-
95
-
96
-
97
-
98
-
99
-
100
-
101
-
102
-
103
-
104
-
105
-
106
-
107
-
108
-
109
-
110
-
111
-
112
-
113
-
114
-
115
-
116
-
117
-
 118
118 -
 119
119 -
 120
120 -
 121
121 -
 122
122 -
 123
123 -
 124
124 -
 125
125 -
 126
126 -
 127
127 -
 128
128 -
 129
129 -
 130
130 -
 131
131 -
 132
132 -
 133
133 -
 134
134 -
 135
135 -
 136
136 -
 137
137 -
 138
138 -
139
-
140
-
141
-
142
-
143
-
144
-
145
-
146
-
147
-
148
-
149
-
150
-
151
-
152
-
153
-
154
-
155
-
156
-
157
-
158
-
159
-
160
-
161
-
162
-
163
-
164
-
165
-
166
-
167
-
168
-
169
-
170
-
171
-
172
-
173
-
174
-
175
-
176
-
177
-
178
-
179
-
180
-
181
-
182
-
183
-
184
-
185
 |
 |

Table of Contents
At July 30, 2011, Accreting Options were outstanding for 25,207 shares and Fixed Price Options were outstanding for 49,080
shares. The total grant date fair value of stock options that vested during the year was $5.7 million in fiscal year 2011, $2.6 million in
fiscal year 2010 and $5.3 million in fiscal year 2009.
Grant Date Fair Value of Stock Options. All grants of stock options have an exercise price equaling or exceeding the fair
market value of our common stock on the date of grant. Because we are privately held and there is no public market for our common
stock, the fair market value of our common stock is determined by our Compensation Committee at the time option grants are awarded
(Level 3 determination of fair value). In determining the fair value of our common stock, the Compensation Committee considers
such factors as the Company's actual and projected financial results, the principal amount of the Company's indebtedness, valuations
of the Company performed by third parties and other factors it believes are material to the valuation process.
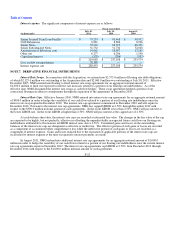
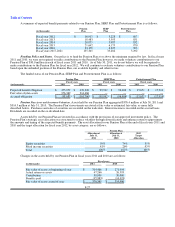
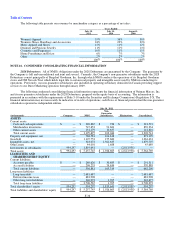
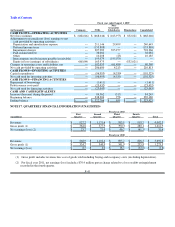
We use the Black-Scholes option-pricing model to determine the fair value of our options as of the date of grant. There were
no stock option grants during fiscal year 2009. We used the following assumptions to estimate the fair value for stock options at grant
date:
Fiscal year ended
July 30, 2011 July 31, 2010
Fixed Price
Options
Accreting
Options
Fixed Price
Options
Accreting
Options
Options granted 10,000 650 4,773 26,806
Weighted average exercise price $ 1,576 $ 1,576 $ 1,128 $ 1,100
Weighted term in years 7 8 8 8
Weighted average volatility 47.6% 47.9% 53.4% 53.8%
Risk-free interest rate 1.9% - 2.5% 2.5% 3.3% 2.3% - 3.3%
Dividend yield — — — —
Weighted average fair value $ 807 $ 720 $ 519 $ 442
Expected volatility is based on a combination of NMG's historical volatility adjusted for our leverage and estimates of
implied volatility of our peer group.
We recognize compensation expense for stock options on a straight-line basis over the vesting period. We recognized non-
cash stock compensation expense of $3.9 million in fiscal year 2011, $5.0 million in fiscal year 2010 (excluding the compensation
charges recorded in connection with the Modification Transactions) and $5.8 million in fiscal year 2009, which is included in selling,
general and administrative expenses. At July 30, 2011, unearned non-cash stock-based compensation that we expect to recognize as
expense through fiscal year 2015 aggregates approximately $9.8 million.
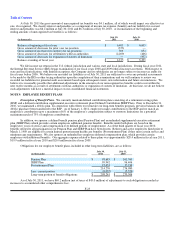
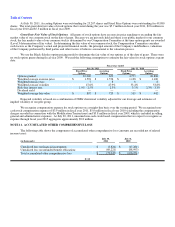
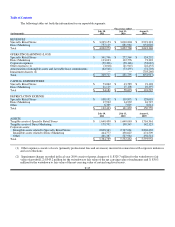
NOTE 11. ACCUMULATED OTHER COMPREHENSIVE LOSS
The following table shows the components of accumulated other comprehensive loss (amounts are recorded net of related
income taxes):
(in thousands)
July 30,
2011
July 31,
2010
Unrealized loss on financial instruments $ (3,824) $ (17,281)
Unrealized loss on unfunded benefit obligations (69,221)(88,993)
Total accumulated other comprehensive loss $ (73,045)$ (106,274)
F-32