Neiman Marcus 2010 Annual Report Download - page 27
Download and view the complete annual report
Please find page 27 of the 2010 Neiman Marcus annual report below. You can navigate through the pages in the report by either clicking on the pages listed below, or by using the keyword search tool below to find specific information within the annual report.-
 1
1 -
2
-
3
-
4
-
5
-
6
-
7
-
8
-
9
-
10
-
11
-
12
-
13
-
14
-
15
-
16
-
 17
17 -
 18
18 -
 19
19 -
 20
20 -
 21
21 -
 22
22 -
 23
23 -
 24
24 -
 25
25 -
 26
26 -
 27
27 -
 28
28 -
 29
29 -
 30
30 -
 31
31 -
 32
32 -
 33
33 -
 34
34 -
 35
35 -
 36
36 -
 37
37 -
38
-
39
-
40
-
41
-
42
-
43
-
44
-
45
-
46
-
47
-
48
-
49
-
50
-
51
-
52
-
53
-
54
-
55
-
56
-
57
-
58
-
59
-
60
-
61
-
62
-
63
-
64
-
65
-
66
-
67
-
68
-
69
-
70
-
71
-
72
-
73
-
74
-
75
-
76
-
77
-
78
-
79
-
80
-
81
-
82
-
83
-
84
-
85
-
86
-
87
-
88
-
89
-
90
-
91
-
92
-
93
-
94
-
95
-
96
-
97
-
98
-
99
-
100
-
101
-
102
-
103
-
104
-
105
-
106
-
107
-
108
-
109
-
110
-
111
-
112
-
113
-
114
-
115
-
116
-
117
-
118
-
119
-
120
-
121
-
122
-
123
-
124
-
125
-
126
-
127
-
128
-
129
-
130
-
131
-
132
-
133
-
134
-
135
-
136
-
137
-
138
-
139
-
140
-
141
-
142
-
143
-
144
-
145
-
146
-
147
-
148
-
149
-
150
-
151
-
152
-
153
-
154
-
155
-
156
-
157
-
158
-
159
-
160
-
161
-
162
-
163
-
164
-
165
-
166
-
167
-
168
-
169
-
170
-
171
-
172
-
173
-
174
-
175
-
176
-
177
-
178
-
179
-
180
-
181
-
182
-
183
-
184
-
185
 |
 |

Table of Contents
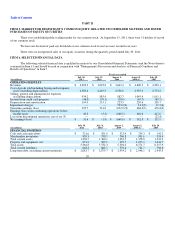
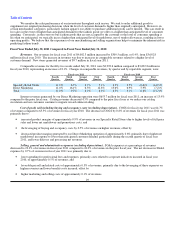
• Operating earnings—Total operating earnings in fiscal year 2011 were $329.7 million, or 8.2% of revenues. Total
operating earnings in fiscal year 2010 were $231.8 million, or 6.3% of revenues. Our operating earnings margin
increased by 1.9% of revenues primarily due to:
• a decrease in COGS by 0.8% of revenues, as described above;
• a decrease in SG&A expenses by 0.7% of revenues, as described above; and
• a decrease in depreciation and amortization expense by 0.9% of revenues reflecting a lower level of capital
expenditures in recent years and lower amortization of short-lived intangible assets; offset by
• a decrease in income from our credit card operations by 0.5% of revenues primarily due to the amendment of terms
in our amended and extended Program Agreement effective July 2010.
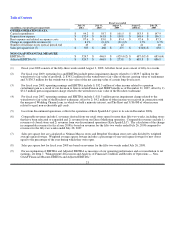
• Refinancing Transactions— As more fully described in Note 6 of the Notes to Consolidated Financial Statements in
Item 15, we executed the following transactions, collectively referred to as the Refinancing Transactions, in the fourth
quarter of fiscal year 2011:
• Amended our Senior Secured Asset-Based Revolving Credit Facility;
• Amended our Senior Secured Term Loan Facility; and
• Repurchased or redeemed $752.4 million principal amount of our Senior Notes.
• Liquidity— Net cash provided by our operating activities was $272.4 million in fiscal year 2011 compared to $268.0
million in fiscal year 2010. We held cash balances of $321.6 million at July 30, 2011 compared to $421.0 million at
July 31, 2010. The decrease in cash balances at July 30, 2011 was primarily due to cash used in connection with the
Refinancing Transactions which included a reduction of $198.2 million in our long-term debt. At July 30, 2011, we had
no borrowings outstanding under our Asset-Based Revolving Credit Facility, $13.7 million of outstanding letters of
credit and $615.8 million of unused borrowing availability.
• Outlook— While economic conditions improved in fiscal year 2011, domestic and global economic conditions remain
volatile and we do not anticipate the return of consumer spending to levels achieved in fiscal years 2007 and 2008 in the
near-term. We plan to maintain an appropriate alignment of our inventory levels and purchases with anticipated
customer demand. We believe the cash generated from our operations along with our cash balances and available
sources of financing will enable us to meet our anticipated cash obligations for fiscal year 2012.
23