Neiman Marcus 2010 Annual Report Download - page 34
Download and view the complete annual report
Please find page 34 of the 2010 Neiman Marcus annual report below. You can navigate through the pages in the report by either clicking on the pages listed below, or by using the keyword search tool below to find specific information within the annual report.-
 1
1 -
2
-
3
-
4
-
5
-
6
-
7
-
8
-
9
-
10
-
11
-
12
-
13
-
14
-
15
-
16
-
17
-
18
-
19
-
20
-
21
-
22
-
23
-
 24
24 -
 25
25 -
 26
26 -
 27
27 -
 28
28 -
 29
29 -
 30
30 -
 31
31 -
 32
32 -
 33
33 -
 34
34 -
 35
35 -
 36
36 -
 37
37 -
 38
38 -
 39
39 -
 40
40 -
 41
41 -
 42
42 -
 43
43 -
 44
44 -
45
-
46
-
47
-
48
-
49
-
50
-
51
-
52
-
53
-
54
-
55
-
56
-
57
-
58
-
59
-
60
-
61
-
62
-
63
-
64
-
65
-
66
-
67
-
68
-
69
-
70
-
71
-
72
-
73
-
74
-
75
-
76
-
77
-
78
-
79
-
80
-
81
-
82
-
83
-
84
-
85
-
86
-
87
-
88
-
89
-
90
-
91
-
92
-
93
-
94
-
95
-
96
-
97
-
98
-
99
-
100
-
101
-
102
-
103
-
104
-
105
-
106
-
107
-
108
-
109
-
110
-
111
-
112
-
113
-
114
-
115
-
116
-
117
-
118
-
119
-
120
-
121
-
122
-
123
-
124
-
125
-
126
-
127
-
128
-
129
-
130
-
131
-
132
-
133
-
134
-
135
-
136
-
137
-
138
-
139
-
140
-
141
-
142
-
143
-
144
-
145
-
146
-
147
-
148
-
149
-
150
-
151
-
152
-
153
-
154
-
155
-
156
-
157
-
158
-
159
-
160
-
161
-
162
-
163
-
164
-
165
-
166
-
167
-
168
-
169
-
170
-
171
-
172
-
173
-
174
-
175
-
176
-
177
-
178
-
179
-
180
-
181
-
182
-
183
-
184
-
185
 |
 |

Table of Contents
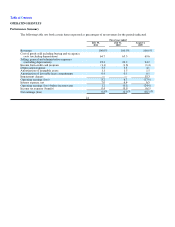
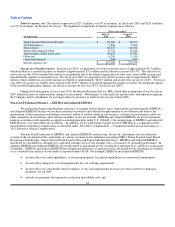
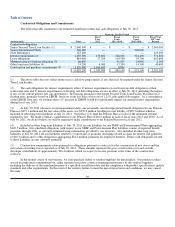
Income from credit card program. We earned Program Income of $46.0 million, or 1.1% of revenues, in fiscal year 2011
compared to $59.1 million, or 1.6% of revenues, in fiscal year 2010. We amended and extended our Program Agreement effective
July 2010. The decrease in Program Income in fiscal year 2011 compared to the prior fiscal year is attributable to the impact of the
change in the amended contractual terms of our Program Agreement.
Depreciation expense. Depreciation expense was $132.4 million, or 3.3% of revenues, in fiscal year 2011 compared to
$141.8 million, or 3.8% of revenues, in fiscal year 2010. The decrease in depreciation resulted primarily from recent lower levels of
capital spending.
Amortization expense. Amortization of intangible assets (primarily customer lists and favorable lease commitments)
aggregated $62.5 million, or 1.6% of revenues, in fiscal year 2011 compared to $73.3 million, or 2.0% of revenues, in fiscal year
2010. The decrease in amortization is primarily due to certain short-lived intangible assets becoming fully amortized.
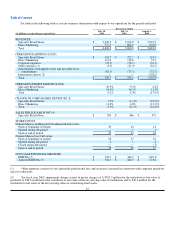
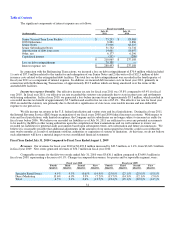
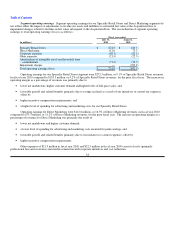
Segment operating earnings. Segment operating earnings for our Specialty Retail Stores and Direct Marketing segments do
not reflect either the impact of adjustments to revalue our assets and liabilities to estimated fair value at the Acquisition Date or
impairment charges related to declines in fair value subsequent to the Acquisition Date. The reconciliation of segment operating
earnings to total operating earnings is as follows:
Fiscal year ended
(in millions)
July 30,
2011
July 31,
2010
Specialty Retail Stores $ 341.7 $ 272.5
Direct Marketing 113.0 112.6
Corporate expenses (59.5) (58.1)
Other expenses (3.0) (21.9)
Amortization of intangible assets and favorable lease commitments (62.5)(73.3)
Total operating earnings $ 329.7 $ 231.8
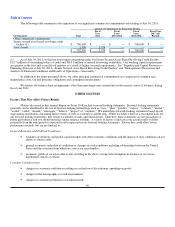
Operating earnings for our Specialty Retail Stores segment were $341.7 million, or 10.5% of Specialty Retail Stores
revenues, for fiscal year 2011 compared to $272.5 million, or 9.1% of Specialty Retail Stores revenues, for the prior fiscal year. The
increase in operating margin as a percentage of revenues was primarily due to:
• higher levels of full-price sales and lower net markdowns and promotions costs; and
• the leveraging of a significant portion of our expenses on the higher level of revenues; offset by
• higher marketing and selling costs; and
• a lower level of income from our credit card program.
Operating earnings for Direct Marketing were $113.0 million, or 14.9% of Direct Marketing revenues, in fiscal year 2011
compared to $112.6 million, or 16.5% of Direct Marketing revenues, for the prior fiscal year. The decrease in operating margin as a
percentage of revenues for Direct Marketing was primarily the result of:
• decreased product margins primarily due to higher net markdowns and lower delivery and processing net revenues;
• higher marketing and selling costs; and
• a lower level of income from our credit card program.
Other expenses of $3.0 million in fiscal year 2011 and $21.9 million in fiscal year 2010 consist of costs (primarily
professional fees and severance) incurred in connection with corporate initiatives and cost reductions.
Interest expense, net. Net interest expense was $280.5 million, or 7.0% of revenues, in fiscal year 2011 and $237.1 million,
or 6.4% of revenues, for the prior fiscal year. Excluding the $70.4 million loss on debt extinguishment, net interest expense decreased
by $27.0 million in fiscal year 2011 due to lower interest rates on our floating rate indebtedness.
30