Neiman Marcus 2010 Annual Report Download - page 111
Download and view the complete annual report
Please find page 111 of the 2010 Neiman Marcus annual report below. You can navigate through the pages in the report by either clicking on the pages listed below, or by using the keyword search tool below to find specific information within the annual report.-
 1
1 -
2
-
3
-
4
-
5
-
6
-
7
-
8
-
9
-
10
-
11
-
12
-
13
-
14
-
15
-
16
-
17
-
18
-
19
-
20
-
21
-
22
-
23
-
24
-
25
-
26
-
27
-
28
-
29
-
30
-
31
-
32
-
33
-
34
-
35
-
36
-
37
-
38
-
39
-
40
-
41
-
42
-
43
-
44
-
45
-
46
-
47
-
48
-
49
-
50
-
51
-
52
-
53
-
54
-
55
-
56
-
57
-
58
-
59
-
60
-
61
-
62
-
63
-
64
-
65
-
66
-
67
-
68
-
69
-
70
-
71
-
72
-
73
-
74
-
75
-
76
-
77
-
78
-
79
-
80
-
81
-
82
-
83
-
84
-
85
-
86
-
87
-
88
-
89
-
90
-
91
-
92
-
93
-
94
-
95
-
96
-
97
-
98
-
99
-
100
-
 101
101 -
 102
102 -
 103
103 -
 104
104 -
 105
105 -
 106
106 -
 107
107 -
 108
108 -
 109
109 -
 110
110 -
 111
111 -
 112
112 -
 113
113 -
 114
114 -
 115
115 -
 116
116 -
 117
117 -
 118
118 -
 119
119 -
 120
120 -
 121
121 -
122
-
123
-
124
-
125
-
126
-
127
-
128
-
129
-
130
-
131
-
132
-
133
-
134
-
135
-
136
-
137
-
138
-
139
-
140
-
141
-
142
-
143
-
144
-
145
-
146
-
147
-
148
-
149
-
150
-
151
-
152
-
153
-
154
-
155
-
156
-
157
-
158
-
159
-
160
-
161
-
162
-
163
-
164
-
165
-
166
-
167
-
168
-
169
-
170
-
171
-
172
-
173
-
174
-
175
-
176
-
177
-
178
-
179
-
180
-
181
-
182
-
183
-
184
-
185
 |
 |

Table of Contents
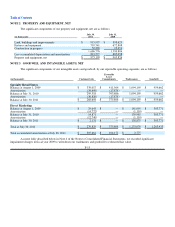
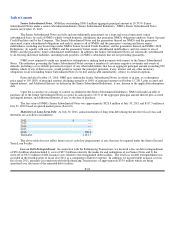
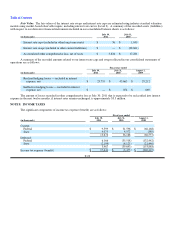
NOTE 2. PROPERTY AND EQUIPMENT, NET
The significant components of our property and equipment, net are as follows:
(in thousands)
July 30,
2011
July 31,
2010
Land, buildings and improvements $ 915,997 $ 898,625
Fixtures and equipment 718,541 672,808
Construction in progress 52,238 19,451
1,686,776 1,590,884
Less accumulated depreciation and amortization 813,577 685,058
Property and equipment, net $ 873,199 $ 905,826
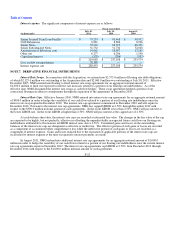
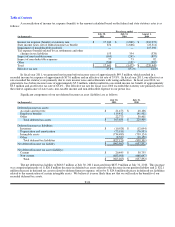
NOTE 3. GOODWILL AND INTANGIBLE ASSETS, NET
The significant components of our intangible assets and goodwill, by our reportable operating segments, are as follows:
(in thousands) Customer Lists
Favorable
Lease
Commitments Tradenames Goodwill
Specialty Retail Stores
Balance at August 1, 2009 $ 339,017 $ 411,564 $ 1,094,195 $ 959,662
Amortization (39,499)(17,878)— —
Balance at July 31, 2010 299,518 393,686 1,094,195 959,662
Amortization (30,820)(17,878)— —
Balance at July 30, 2011 $ 268,698 $ 375,808 $ 1,094,195 $ 959,662
Direct Marketing
Balance at August 1, 2009 $ 29,643 $ — $ 141,095 $ 303,771
Amortization (14,772)— (1,110)—
Balance at July 31, 2010 14,871 — 139,985 303,771
Amortization (12,740)— (1,110)—
Balance at July 30, 2011 $ 2,131 $ — $ 138,875 $ 303,771
Total at July 30, 2011 $ 270,829 $ 375,808 $ 1,233,070 $ 1,263,433
Total accumulated amortization at July 30, 2011 $ 305,661 $ 104,172 $ 2,775
As more fully described below in Note 4 of the Notes to Consolidated Financial Statements, we recorded significant
impairment charges in fiscal year 2009 to writedown our tradenames and goodwill to estimated fair value.
F-15