Neiman Marcus 2010 Annual Report Download - page 29
Download and view the complete annual report
Please find page 29 of the 2010 Neiman Marcus annual report below. You can navigate through the pages in the report by either clicking on the pages listed below, or by using the keyword search tool below to find specific information within the annual report.-
 1
1 -
2
-
3
-
4
-
5
-
6
-
7
-
8
-
9
-
10
-
11
-
12
-
13
-
14
-
15
-
16
-
17
-
18
-
 19
19 -
 20
20 -
 21
21 -
 22
22 -
 23
23 -
 24
24 -
 25
25 -
 26
26 -
 27
27 -
 28
28 -
 29
29 -
 30
30 -
 31
31 -
 32
32 -
 33
33 -
 34
34 -
 35
35 -
 36
36 -
 37
37 -
 38
38 -
 39
39 -
40
-
41
-
42
-
43
-
44
-
45
-
46
-
47
-
48
-
49
-
50
-
51
-
52
-
53
-
54
-
55
-
56
-
57
-
58
-
59
-
60
-
61
-
62
-
63
-
64
-
65
-
66
-
67
-
68
-
69
-
70
-
71
-
72
-
73
-
74
-
75
-
76
-
77
-
78
-
79
-
80
-
81
-
82
-
83
-
84
-
85
-
86
-
87
-
88
-
89
-
90
-
91
-
92
-
93
-
94
-
95
-
96
-
97
-
98
-
99
-
100
-
101
-
102
-
103
-
104
-
105
-
106
-
107
-
108
-
109
-
110
-
111
-
112
-
113
-
114
-
115
-
116
-
117
-
118
-
119
-
120
-
121
-
122
-
123
-
124
-
125
-
126
-
127
-
128
-
129
-
130
-
131
-
132
-
133
-
134
-
135
-
136
-
137
-
138
-
139
-
140
-
141
-
142
-
143
-
144
-
145
-
146
-
147
-
148
-
149
-
150
-
151
-
152
-
153
-
154
-
155
-
156
-
157
-
158
-
159
-
160
-
161
-
162
-
163
-
164
-
165
-
166
-
167
-
168
-
169
-
170
-
171
-
172
-
173
-
174
-
175
-
176
-
177
-
178
-
179
-
180
-
181
-
182
-
183
-
184
-
185
 |
 |

Table of Contents
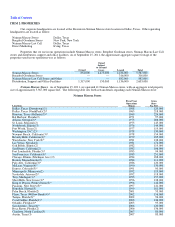
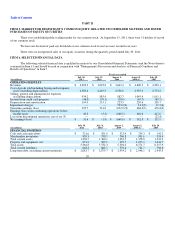
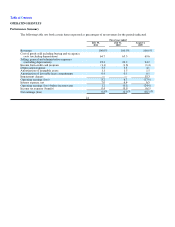
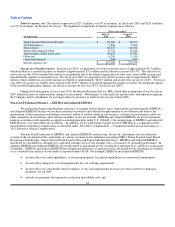
Set forth in the following table is certain summary information with respect to our operations for the periods indicated.
Fiscal year ended
(in millions, except sales per square foot)
July 30,
2011
July 31,
2010
August 1,
2009
REVENUES
Specialty Retail Stores $ 3,245.2 $ 3,010.8 $ 2,991.3
Direct Marketing 757.1 682.0 652.0
Total $ 4,002.3 $ 3,692.8 $ 3,643.3
OPERATING EARNINGS (LOSS)
Specialty Retail Stores $ 341.7 $ 272.5 $ 124.3
Direct Marketing 113.0 112.6 73.3
Corporate expenses (59.5) (58.1) (52.1)
Other expenses (1) (3.0) (21.9) (22.5)
Amortization of intangible assets and favorable lease
commitments (62.5) (73.3) (72.7)
Impairment charges (2) — — (703.2)
Total $ 329.7 $ 231.8 $ (652.9)
OPERATING PROFIT MARGIN (LOSS)
Specialty Retail Stores 10.5% 9.1% 4.2%
Direct Marketing 14.9% 16.5% 11.2%
Total 8.2% 6.3% (17.9)%
CHANGE IN COMPARABLE REVENUES (3)
Specialty Retail Stores 7.5% (1.2)% (23.2)%
Direct Marketing 11.0% 4.6% (12.2)%
Total 8.1% (0.1)% (21.4)%
SALES PER SQUARE FOOT (4)
Specialty Retail Stores $ 505 $ 466 $ 475
STORE COUNT
Neiman Marcus and Bergdorf Goodman full-line stores:
Open at beginning of period 43 42 41
Opened during the period — 1 1
Open at end of period 43 43 42
Neiman Marcus Last Call stores:
Open at beginning of period 28 27 24
Opened during the period 2 1 4
Closed during the period — — (1)
Open at end of period 30 28 27
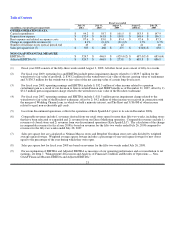
NON-GAAP FINANCIAL MEASURE
EBITDA (5) $ 524.7 $ 446.9 $ (429.4)
Adjusted EBITDA (5) $ 524.7 $ 446.9 $ 273.8
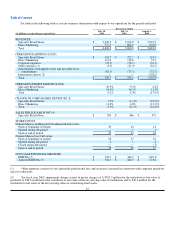
(1) Other expenses consists of costs (primarily professional fees and severance) incurred in connection with corporate initiatives
and cost reductions.
(2) For fiscal year 2009, impairment charges consist of pretax charges of 1) $329.7 million for the writedown to fair value of
goodwill, 2) $343.2 million for the writedown to fair value of the net carrying value of tradenames and 3) $30.3 million for the
writedown to fair value of the net carrying value of certain long-lived assets.
25