Neiman Marcus 2010 Annual Report Download - page 30
Download and view the complete annual report
Please find page 30 of the 2010 Neiman Marcus annual report below. You can navigate through the pages in the report by either clicking on the pages listed below, or by using the keyword search tool below to find specific information within the annual report.-
 1
1 -
2
-
3
-
4
-
5
-
6
-
7
-
8
-
9
-
10
-
11
-
12
-
13
-
14
-
15
-
16
-
17
-
18
-
19
-
 20
20 -
 21
21 -
 22
22 -
 23
23 -
 24
24 -
 25
25 -
 26
26 -
 27
27 -
 28
28 -
 29
29 -
 30
30 -
 31
31 -
 32
32 -
 33
33 -
 34
34 -
 35
35 -
 36
36 -
 37
37 -
 38
38 -
 39
39 -
 40
40 -
41
-
42
-
43
-
44
-
45
-
46
-
47
-
48
-
49
-
50
-
51
-
52
-
53
-
54
-
55
-
56
-
57
-
58
-
59
-
60
-
61
-
62
-
63
-
64
-
65
-
66
-
67
-
68
-
69
-
70
-
71
-
72
-
73
-
74
-
75
-
76
-
77
-
78
-
79
-
80
-
81
-
82
-
83
-
84
-
85
-
86
-
87
-
88
-
89
-
90
-
91
-
92
-
93
-
94
-
95
-
96
-
97
-
98
-
99
-
100
-
101
-
102
-
103
-
104
-
105
-
106
-
107
-
108
-
109
-
110
-
111
-
112
-
113
-
114
-
115
-
116
-
117
-
118
-
119
-
120
-
121
-
122
-
123
-
124
-
125
-
126
-
127
-
128
-
129
-
130
-
131
-
132
-
133
-
134
-
135
-
136
-
137
-
138
-
139
-
140
-
141
-
142
-
143
-
144
-
145
-
146
-
147
-
148
-
149
-
150
-
151
-
152
-
153
-
154
-
155
-
156
-
157
-
158
-
159
-
160
-
161
-
162
-
163
-
164
-
165
-
166
-
167
-
168
-
169
-
170
-
171
-
172
-
173
-
174
-
175
-
176
-
177
-
178
-
179
-
180
-
181
-
182
-
183
-
184
-
185
 |
 |

Table of Contents
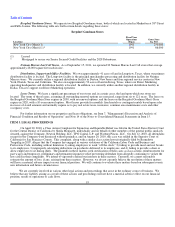
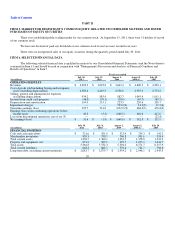
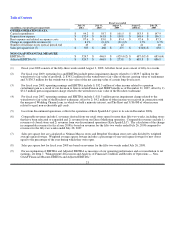
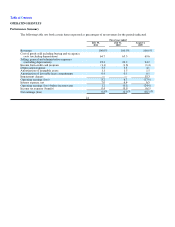
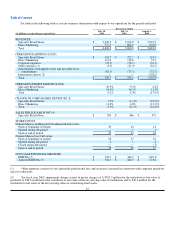
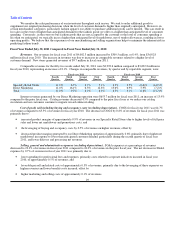
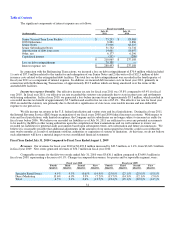
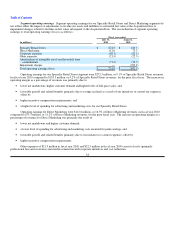
(3) Comparable revenues include 1) revenues derived from our retail stores open for more than fifty-two weeks, including stores
that have been relocated or expanded and 2) revenues from our Direct Marketing operation. Comparable revenues exclude revenues
of closed stores. The calculation of the change in comparable revenues for fiscal year 2009 is based on revenues for the fifty-two
weeks ended August 1, 2009 compared to revenues for the fifty-two weeks ended July 26, 2008.
(4) Sales per square foot are calculated as Neiman Marcus stores and Bergdorf Goodman stores net sales divided by weighted
average square footage. Weighted average square footage includes a percentage of year-end square footage for new stores equal to the
percentage of the year during which they were open.
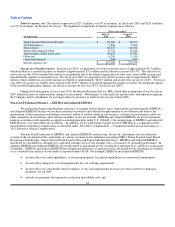
(5) For an explanation of EBITDA and Adjusted EBITDA as measures of our operating performance and a reconciliation to net
earnings, see "Management's Discussion and Analysis of Financial Condition and Results of Operations — Non-GAAP Financial
Measure-EBITDA and Adjusted EBITDA."
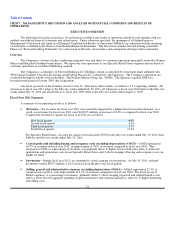
Factors Affecting Our Results
Revenues. We generate our revenues from the sale of high-end merchandise through our Specialty Retail Stores and our
Direct Marketing operation. Components of our revenues include:
• Sales of merchandise—Revenues are recognized at the later of the point-of-sale or the delivery of goods to the
customer. Revenues are reduced when customers return goods previously purchased. We maintain reserves for
anticipated sales returns primarily based on our historical trends. Revenues exclude sales taxes collected from our
customers.
• Delivery and processing—We generate revenues from delivery and processing charges related to merchandise delivered
to our customers.
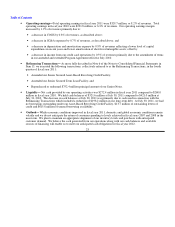
Our revenues can be affected by the following factors:
• general economic conditions;
• changes in the level of consumer spending generally and, specifically, on luxury goods;
• changes in the level of full-price sales;
• changes in the level of promotional events conducted;
• our ability to successfully implement our expansion and growth strategies; and
• the rate of growth in internet revenues.
In addition, our revenues are seasonal, as discussed below under "Seasonality."
Cost of goods sold including buying and occupancy costs (excluding depreciation). COGS consists of the following
components:
• Inventory costs—We utilize the retail inventory method of accounting. Under the retail inventory method, the valuation
of inventories at cost and the resulting gross margins are determined by applying a calculated cost-to-retail ratio, for
various groupings of similar items, to the retail value of our inventories. The cost of the inventory reflected on the
consolidated balance sheet is decreased by charges to cost of goods sold at the time the retail value of the inventory is
lowered through the use of markdowns. Hence, earnings are negatively impacted when merchandise is marked down.
With the introduction of new fashions in the first and third fiscal quarters and our emphasis on full-price selling in these
quarters, a lower level of markdowns and higher margins are characteristic of these quarters.
• Buying costs—Buying costs consist primarily of salaries and expenses incurred by our merchandising and buying
operations.
26