Neiman Marcus 2010 Annual Report Download - page 24
Download and view the complete annual report
Please find page 24 of the 2010 Neiman Marcus annual report below. You can navigate through the pages in the report by either clicking on the pages listed below, or by using the keyword search tool below to find specific information within the annual report.-
 1
1 -
2
-
3
-
4
-
5
-
6
-
7
-
8
-
9
-
10
-
11
-
12
-
13
-
 14
14 -
 15
15 -
 16
16 -
 17
17 -
 18
18 -
 19
19 -
 20
20 -
 21
21 -
 22
22 -
 23
23 -
 24
24 -
 25
25 -
 26
26 -
 27
27 -
 28
28 -
 29
29 -
 30
30 -
 31
31 -
 32
32 -
 33
33 -
 34
34 -
35
-
36
-
37
-
38
-
39
-
40
-
41
-
42
-
43
-
44
-
45
-
46
-
47
-
48
-
49
-
50
-
51
-
52
-
53
-
54
-
55
-
56
-
57
-
58
-
59
-
60
-
61
-
62
-
63
-
64
-
65
-
66
-
67
-
68
-
69
-
70
-
71
-
72
-
73
-
74
-
75
-
76
-
77
-
78
-
79
-
80
-
81
-
82
-
83
-
84
-
85
-
86
-
87
-
88
-
89
-
90
-
91
-
92
-
93
-
94
-
95
-
96
-
97
-
98
-
99
-
100
-
101
-
102
-
103
-
104
-
105
-
106
-
107
-
108
-
109
-
110
-
111
-
112
-
113
-
114
-
115
-
116
-
117
-
118
-
119
-
120
-
121
-
122
-
123
-
124
-
125
-
126
-
127
-
128
-
129
-
130
-
131
-
132
-
133
-
134
-
135
-
136
-
137
-
138
-
139
-
140
-
141
-
142
-
143
-
144
-
145
-
146
-
147
-
148
-
149
-
150
-
151
-
152
-
153
-
154
-
155
-
156
-
157
-
158
-
159
-
160
-
161
-
162
-
163
-
164
-
165
-
166
-
167
-
168
-
169
-
170
-
171
-
172
-
173
-
174
-
175
-
176
-
177
-
178
-
179
-
180
-
181
-
182
-
183
-
184
-
185
 |
 |

Table of Contents
PART II
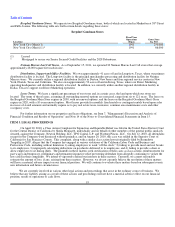
ITEM 5. MARKET FOR REGISTRANT'S COMMON EQUITY, RELATED STOCKHOLDER MATTERS AND ISSUER
PURCHASES OF EQUITY SECURITIES
There is no established public trading market for our common stock. At September 15, 2011, there were 31 holders of record
of our common stock.
We have not declared or paid any dividends on our common stock in our two most recent fiscal years.
There were no unregistered sales of our equity securities during the quarterly period ended July 30, 2011.
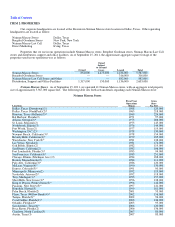
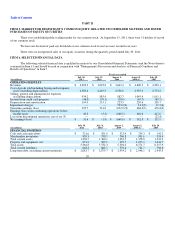
ITEM 6. SELECTED FINANCIAL DATA
The following selected financial data is qualified in entirety by our Consolidated Financial Statements (and the Notes thereto)
contained in Item 15 and should be read in conjunction with "Management's Discussion and Analysis of Financial Condition and
Results of Operations" in Item 7.
Fiscal year ended
(in millions)
July 30,
2011
July 31,
2010
August 1,
2009
August 2,
2008 (1)
July 28,
2007
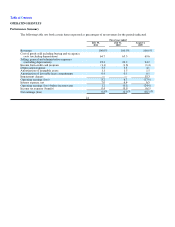
OPERATING RESULTS
Revenues $ 4,002.3 $ 3,692.8 $ 3,643.3 $ 4,600.5 $ 4,390.1
Cost of goods sold including buying and occupancy
costs (excluding depreciation) 2,589.4 2,419.5 2,536.8 2,935.0 2,753.8
Selling, general and administrative expenses
(excluding depreciation) 934.2 885.4 882.7 1,045.4 1,015.1
Income from credit card program (46.0) (59.1) (50.0) (65.7) (65.7)
Depreciation and amortization 194.9 215.1 223.5 220.6 208.7
Impairment charges — — 703.2(2) 31.3(3) 11.5(4)
Operating earnings (loss) 329.7 231.8 (652.9)(2) 466.4(3) 476.8(4)
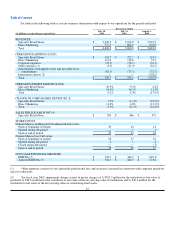
Earnings (loss) from continuing operations before
income taxes 49.3 (5.3) (888.5) 226.6 217.0
Loss from discontinued operations, net of tax (5) — — — — (22.8)
Net earnings (loss) $ 31.6 $ (1.8) $ (668.0) $ 142.8 $ 111.9
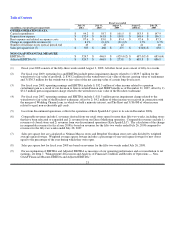
(in millions)
July 30,
2011
July 31,
2010
August 1,
2009
August 2,
2008 (1)
July 28,
2007
FINANCIAL POSITION
Cash and cash equivalents $ 321.6 $ 421.0 $ 323.4 $ 239.2 $ 141.2
Merchandise inventories 839.3 790.5 766.8 991.6 933.4
Total current assets 1,302.7 1,360.1 1,234.5 1,378.6 1,231.9
Property and equipment, net 873.2 905.8 992.7 1,075.3 1,043.7
Total assets 5,364.8 5,532.3 5,594.0 6,571.7 6,517.9
Total current liabilities 662.2 662.5 576.4 721.7 784.8
Long-term debt, excluding current maturities $ 2,681.7 $ 2,879.7 $ 2,954.2 $ 2,946.1 $ 2,945.9
20