HSBC 2013 Annual Report Download - page 97
Download and view the complete annual report
Please find page 97 of the 2013 HSBC annual report below. You can navigate through the pages in the report by either clicking on the pages listed below, or by using the keyword search tool below to find specific information within the annual report.-
 1
1 -
2
-
3
-
4
-
5
-
6
-
7
-
8
-
9
-
10
-
11
-
12
-
13
-
14
-
15
-
16
-
17
-
18
-
19
-
20
-
21
-
22
-
23
-
24
-
25
-
26
-
27
-
28
-
29
-
30
-
31
-
32
-
33
-
34
-
35
-
36
-
37
-
38
-
39
-
40
-
41
-
42
-
43
-
44
-
45
-
46
-
47
-
48
-
49
-
50
-
51
-
52
-
53
-
54
-
55
-
56
-
57
-
58
-
59
-
60
-
61
-
62
-
63
-
64
-
65
-
66
-
67
-
68
-
69
-
70
-
71
-
72
-
73
-
74
-
75
-
76
-
77
-
78
-
79
-
80
-
81
-
82
-
83
-
84
-
85
-
86
-
 87
87 -
 88
88 -
 89
89 -
 90
90 -
 91
91 -
 92
92 -
 93
93 -
 94
94 -
 95
95 -
 96
96 -
 97
97 -
 98
98 -
 99
99 -
 100
100 -
 101
101 -
 102
102 -
 103
103 -
 104
104 -
 105
105 -
 106
106 -
 107
107 -
108
-
109
-
110
-
111
-
112
-
113
-
114
-
115
-
116
-
117
-
118
-
119
-
120
-
121
-
122
-
123
-
124
-
125
-
126
-
127
 |
 |

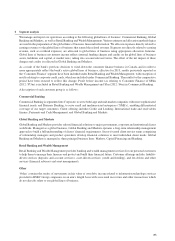
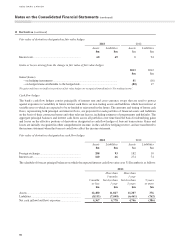
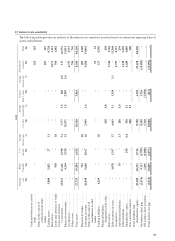
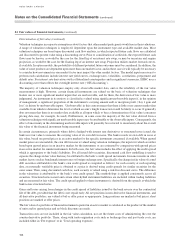
11 Derivatives (continued)
2012
3 months
or less
$m
More than
3 months
but less than
1 year
$m
More than
1 year
but less than
5 years
$m
5 years
or more
$m
Assets .......................................................................... 17,239 14,621 11,826 119
Liabilities .................................................................... (7,622) (6,048) (4,364) (387)
Net cash inflow/(outflow) exposure ............................ 9,617 8,573 7,462 (268)
The gains and losses on ineffective portions of such derivatives are recognized immediately in ‘Net trading income’.
During 2013, a gain of $5m (2012: gain of $3m) was recognized due to hedge ineffectiveness.
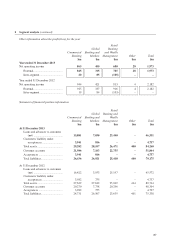
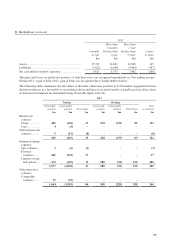
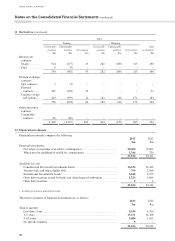
The following tables summarize the fair values of the bank’s derivative portfolio at 31 December segregated between
derivatives that are in a favourable or receivable position and those in an unfavourable or payable position. Fair values
of derivative instruments are determined using observable inputs (note 24).
2013
Trading Hedging
Favourable
position
$m
Unfavourable
position
$m
Net position
$m
Favourable
position
$m
Unfavourable
position
$m
Net position
$m
Total
net position
$m
Interest rate
contracts
Swaps .............. 483 (436) 47 220 (135) 85 132
Caps ................. 4 (4) – – – – –
Other interest rate
contracts .......... 5 (13) (8) – – – (8)
492 (453) 39 220 (135) 85 124
Foreign exchange
contracts
Spot contracts .. 3 (6) (3) – – – (3)
Forward
contracts ........ 602 (565) 37 – – – 37
Currency swaps
and options .... 472 (459) 13 288 (93) 195 208
1,077 (1,030) 47 288 (93) 195 242
Other derivative
contracts
Commodity
contracts ........ 35 (35) – – – – –
1,604 (1,518) 86 508 (228) 280 366
95