HSBC 2013 Annual Report Download - page 13
Download and view the complete annual report
Please find page 13 of the 2013 HSBC annual report below. You can navigate through the pages in the report by either clicking on the pages listed below, or by using the keyword search tool below to find specific information within the annual report.-
 1
1 -
2
-
 3
3 -
 4
4 -
 5
5 -
 6
6 -
 7
7 -
 8
8 -
 9
9 -
 10
10 -
 11
11 -
 12
12 -
 13
13 -
 14
14 -
 15
15 -
 16
16 -
 17
17 -
 18
18 -
 19
19 -
 20
20 -
 21
21 -
 22
22 -
 23
23 -
24
-
25
-
26
-
27
-
28
-
29
-
30
-
31
-
32
-
33
-
34
-
35
-
36
-
37
-
38
-
39
-
40
-
41
-
42
-
43
-
44
-
45
-
46
-
47
-
48
-
49
-
50
-
51
-
52
-
53
-
54
-
55
-
56
-
57
-
58
-
59
-
60
-
61
-
62
-
63
-
64
-
65
-
66
-
67
-
68
-
69
-
70
-
71
-
72
-
73
-
74
-
75
-
76
-
77
-
78
-
79
-
80
-
81
-
82
-
83
-
84
-
85
-
86
-
87
-
88
-
89
-
90
-
91
-
92
-
93
-
94
-
95
-
96
-
97
-
98
-
99
-
100
-
101
-
102
-
103
-
104
-
105
-
106
-
107
-
108
-
109
-
110
-
111
-
112
-
113
-
114
-
115
-
116
-
117
-
118
-
119
-
120
-
121
-
122
-
123
-
124
-
125
-
126
-
127
 |
 |

11
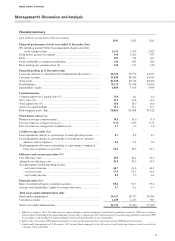
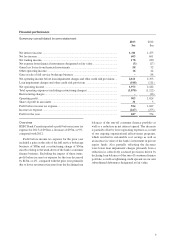
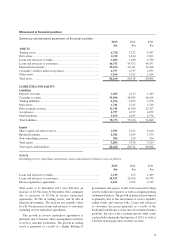
Movement in financial position
Summary consolidated statement of financial position
2013
$m
2012
$m 2011
$m
ASSETS
Trading assets ........................................................................................ 6,728 5,272 4,587
Derivatives ............................................................................................ 2,112 1,810 2,203
Loans and advances to banks ................................................................ 1,482 1,480 4,530
Loans and advances to customers ......................................................... 46,351 45,572 44,357
Financial investments ............................................................................ 21,814 20,411 19,168
Customer’s liability under acceptances................................................. 4,757 4,737 4,059
Other assets ........................................................................................... 1,016 1,432 1,164
Total assets ............................................................................................ 84,260 80,714 80,068
LIABILITIES AND EQUITY
Liabilities
Deposits by banks ................................................................................. 1,205 2,173 1,329
Customer accounts ................................................................................ 51,844 48,304 46,614
Trading liabilities .................................................................................. 4,396 2,672 2,996
Derivatives ............................................................................................ 1,746 1,415 1,746
Debt securities in issue .......................................................................... 11,348 11,980 13,327
Acceptances .......................................................................................... 4,757 4,737 4,059
Other liabilities ...................................................................................... 3,879 4,057 4,778
Total liabilities ...................................................................................... 79,175 75,338 74,849
Equity
Share capital and other reserves ............................................................ 1,959 2,452 2,610
Retained earnings .................................................................................. 2,926 2,694 2,379
Non-controlling interests ...................................................................... 200 230 230
Total equity ........................................................................................... 5,085 5,376 5,219
Total equity and liabilities ..................................................................... 84,260 80,714 80,068
Assets
Excluding reverse repurchase agreements, loans and advances balances were as follows:
2013
$m
2012
$m 2011
$m
Loans and advances to banks ................................................................ 1,149 673 1,489
Loans and advances to customers ......................................................... 40,523 42,456 43,479
Reverse repurchase agreements ............................................................ 6,161 3,923 3,919
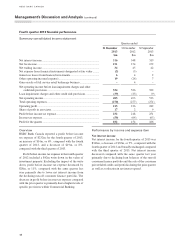
Total assets at 31 December 2013 were $84.3bn, an
increase of $3.5bn from 31 December 2012, primarily
due to increases of $2.2bn in reverse repurchase
agreements, $1.5bn in trading assets, and $1.4bn in
financial investments. The increase was partially offset
by a $1.9bn decrease in loans and advances to customers
excluding reverse repurchase agreements.
The growth in reverse repurchase agreements is
primarily due to balance sheet management activities
as well as customer facilitation. The growth in trading
assets is primarily as a result of a higher holding of
government and agency bonds from increased trading
activity in the rates business as well as a higher pending
settlement balances. The growth in financial investments
is primarily due to the investment of excess liquidity
within bonds and treasury bills. Loans and advances
to customers decreased primarily as a result of the
declining loan balances of the run-off consumer finance
portfolio, the sale of the consumer private label credit
card portfolio during the third quarter of 2013, as well as
a decline in mortgage and overdraft accounts.