HSBC 2013 Annual Report Download - page 100
Download and view the complete annual report
Please find page 100 of the 2013 HSBC annual report below. You can navigate through the pages in the report by either clicking on the pages listed below, or by using the keyword search tool below to find specific information within the annual report.-
 1
1 -
2
-
3
-
4
-
5
-
6
-
7
-
8
-
9
-
10
-
11
-
12
-
13
-
14
-
15
-
16
-
17
-
18
-
19
-
20
-
21
-
22
-
23
-
24
-
25
-
26
-
27
-
28
-
29
-
30
-
31
-
32
-
33
-
34
-
35
-
36
-
37
-
38
-
39
-
40
-
41
-
42
-
43
-
44
-
45
-
46
-
47
-
48
-
49
-
50
-
51
-
52
-
53
-
54
-
55
-
56
-
57
-
58
-
59
-
60
-
61
-
62
-
63
-
64
-
65
-
66
-
67
-
68
-
69
-
70
-
71
-
72
-
73
-
74
-
75
-
76
-
77
-
78
-
79
-
80
-
81
-
82
-
83
-
84
-
85
-
86
-
87
-
88
-
89
-
 90
90 -
 91
91 -
 92
92 -
 93
93 -
 94
94 -
 95
95 -
 96
96 -
 97
97 -
 98
98 -
 99
99 -
 100
100 -
 101
101 -
 102
102 -
 103
103 -
 104
104 -
 105
105 -
 106
106 -
 107
107 -
 108
108 -
 109
109 -
 110
110 -
111
-
112
-
113
-
114
-
115
-
116
-
117
-
118
-
119
-
120
-
121
-
122
-
123
-
124
-
125
-
126
-
127
 |
 |

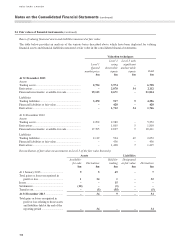
HSBC BANK CANADA
98
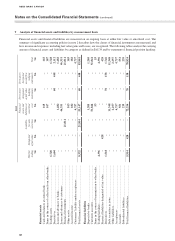
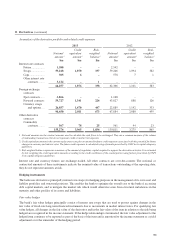
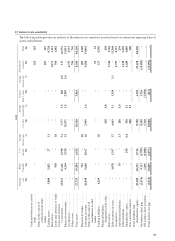
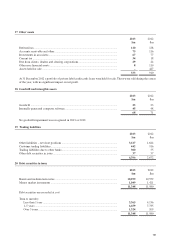
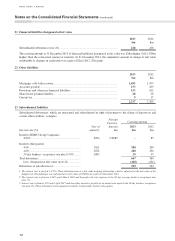
13 Interest rate sensitivity (continued)
2012
Floating
rate
$m
Within
3 months
$m
3–12
months
$m
Average
interest rate
%1–5 years
$m
Average
interest rate
%
Greater
than 5 years
$m
Average
interest rate
%
Non-interest
sensitive
$m Total
$m
Cash and balances at central
bank ................................. – – – – – 56 56
Items in the course of
collection from other
banks ............................... – – – – – 90 90
Trading assets ........................ 2,682 2,541 49 1.2 – – – 5,272
Derivatives ............................ – – – – – 1,810 1,810
Loans and advances to banks – 1,282 – 1.3 – – 198 1,480
Loans and advances
to customers .................... 27,183 8,885 2,505 3.4 6,625 4.0 79 4.9 295 45,572
Financial investments ............ – 743 4,017 1.5 14,388 1.6 1,263 2.3 – 20,411
Acceptances .......................... – – – – – 4,737 4,737
Other assets ........................... – – – – – 1,286 1,286
Total assets ............................ 29,865 13,451 6,571 21,013 1,342 8,472 80,714
Deposits by banks ................. – 1,556 1 0.9 – – 616 2,173
Customer accounts ................ 23,501 5,982 6,541 1.0 4,045 2.7 – 2.1 8,235 48,304
Items in the course of
transmission to other
banks ............................... – – – – – 71 71
Trading liabilities .................. 2,546 – – 1.0 – – 126 2,672
Financial liabilities
designated at fair value ... – – – 436 4.8 – – 436
Derivatives ............................ – – – – – 1,415 1,415
Debt securities in issue .......... – 2,931 2,836 2.3 6,120 3.0 93 4.1 – 11,980
Acceptances .......................... – – – – – 4,737 4,737
Subordinated liabilities ......... – 40 – 1.6 284 3.9 – – 324
Other liabilities ...................... – – – – – 3,226 3,226
Shareholders’ equity .............. – 22 65 600 5.6 – 4,459 5,146
Non controlling interest ........ – – – 200 5.2 – 30 230
Total liabilities and
shareholders’ equity ........ 26,047 10,531 9,443 11,685 93 22,915 80,714
On-balance sheet gap ............ 3,818 2,920 (2,872) 9,328 1,249 (14,443) –
Off-balance sheet positions ... – (2,907) 944 3,160 (1,197) – –
Total interest rate gap ............ 3,818 13 (1,928) 12,488 52 (14,443) –
Notes on the Consolidated Financial Statements (continued)
HSBC BANK CANADA