HSBC 2013 Annual Report Download - page 25
Download and view the complete annual report
Please find page 25 of the 2013 HSBC annual report below. You can navigate through the pages in the report by either clicking on the pages listed below, or by using the keyword search tool below to find specific information within the annual report.-
 1
1 -
2
-
3
-
4
-
5
-
6
-
7
-
8
-
9
-
10
-
11
-
12
-
13
-
14
-
 15
15 -
 16
16 -
 17
17 -
 18
18 -
 19
19 -
 20
20 -
 21
21 -
 22
22 -
 23
23 -
 24
24 -
 25
25 -
 26
26 -
 27
27 -
 28
28 -
 29
29 -
 30
30 -
 31
31 -
 32
32 -
 33
33 -
 34
34 -
 35
35 -
36
-
37
-
38
-
39
-
40
-
41
-
42
-
43
-
44
-
45
-
46
-
47
-
48
-
49
-
50
-
51
-
52
-
53
-
54
-
55
-
56
-
57
-
58
-
59
-
60
-
61
-
62
-
63
-
64
-
65
-
66
-
67
-
68
-
69
-
70
-
71
-
72
-
73
-
74
-
75
-
76
-
77
-
78
-
79
-
80
-
81
-
82
-
83
-
84
-
85
-
86
-
87
-
88
-
89
-
90
-
91
-
92
-
93
-
94
-
95
-
96
-
97
-
98
-
99
-
100
-
101
-
102
-
103
-
104
-
105
-
106
-
107
-
108
-
109
-
110
-
111
-
112
-
113
-
114
-
115
-
116
-
117
-
118
-
119
-
120
-
121
-
122
-
123
-
124
-
125
-
126
-
127
 |
 |

23
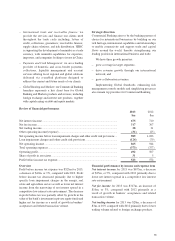
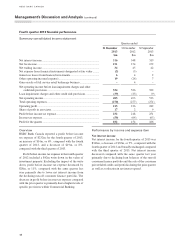
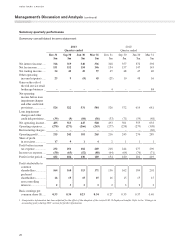
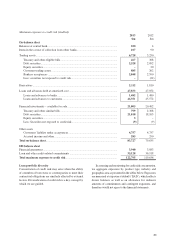
Comments on trends over the past eight quarters
Seasonal factors did not have a significant impact on
our results.
Net interest income declined from 2012 primarily
as a result of the run-off consumer finance portfolio. In
addition contributing to the decrease was lower interest
margins in a competitive low interest rate environment.
The decline in net interest income has been partially
offset by growth in deposit volumes which reduced our
cost of funding.
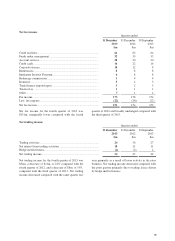
Net fee income trended upwards from 2012 due to
higher funds under management fees driven by customer
investment through our wealth management business.
Net trading income trended upwards through 2012
and downwards through 2013 in line with market
volatility.
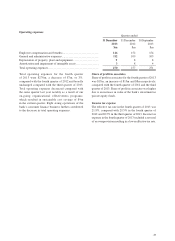
Operating expenses continue to decrease from the
first quarter of 2012 primarily due to cost reductions
relating to the wind-down of the bank’s consumer
finance business and as a result of continued cost
reduction initiatives.
Economic outlook for 2014
At best, keeping pace with US
In 2014, the Canadian economy will, at best, keep pace
with the US expansion. As things stand, we expect Gross
Domestic Product (‘GDP’) growth of 2.3% in both
countries. There are three key areas that we focus on as
helping provide lift, or less of a restraint, to the US, but
which will act as potentially growth-limiting headwinds
to Canada. Those areas are housing, employment, and
fiscal policy.
In the US, the housing sector is starting to emerge
from its post bubble malaise. Meanwhile, in Canada,
the housing sector is poised to step back after having
helped lift the economy out of recession, and acting as
an economic pillar since.
Employment has been a key indicator of economic
rebound in Canada, versus the lacklustre performance
of the US economy in recent years. To wit, full-time
employment in Canada is 3.4% above its pre-recession
peak, but is still 4.1% below its pre-recession peak in
the US. There is more scope for job creation in the US.
Hence, we look for consumption spending in the US to
trend modestly upward in the next two years, from an
advance of 1.9% in 2013, toward an increase of 2.2% in
2015. In Canada, we expect consumption to advance at
2.2% in 2013, but to slow to a 1.9% increase in 2015.
Lastly, in the US fiscal drag is starting to decline,
while Canadian fiscal authorities are entering a critical
period with regard to returning to fiscal balance in the
next couple of years. As a result, we expect less of a
fiscal headwind in the US, and only a small addition to
GDP growth in Canada from fiscal policy. We see 2014
as a key year with regard to the Federal Government’s
plan to return to fiscal surplus in fiscal year 2015/16.
Strict expenditure controls will be necessary as we
anticipate sluggish nominal GDP growth, and thus
sluggish tax revenue growth.
Part and parcel of our outlook for a more moderate
contribution from consumers to Canadian GDP growth
is a further slowdown in the pace of expansion of
household credit. This will help stabilize the household
debt to personal disposable income ratio, which is a key
step in the process of the rebalancing of the household
sector. The household debt slowdown will affect home
renovation activity and existing home sales, both of
which are part of the residential investment component
of GDP, other consumer spending relate to renovations,
and auto sales. After nearly hitting a record high in 2012,
unit auto sales are on pace to achieve new highs in 2013.
A key factor behind the strength in auto sales is the
attraction of very long term, low rate loans. The problem
with these loans is that there is an elevated risk that
borrowers could find themselves in a negative equity
position if they choose to trade in their vehicle before
the loan is paid off. This could lead to a snowballing
effect in auto-related debt, at a time when interest rates
are not as low as they are at present. We look for auto
sales to slow in 2014, though only modestly given that
rates remain low.
Amid consumer restraint other sectors of the economy
are expected to step in to share the burden of GDP
growth, specifically business investment and exports.
We expect the rotation toward business investment
and exports, with a more moderate contribution from
consumer spending and housing, to feature prominently
in 2014. That said, the rebalancing toward business
investment and exports has been choppy, and is not yet
firmly entrenched.
On exports, we look to US domestic demand, and
commodity prices as the most important drivers. Calls
for a weaker Canadian dollar to boost exports are
misplaced. For exports to take on more of the burden
of growth, we require a solid increase in real exports or
an increase in the actual volume of goods and services