HSBC 2013 Annual Report Download - page 63
Download and view the complete annual report
Please find page 63 of the 2013 HSBC annual report below. You can navigate through the pages in the report by either clicking on the pages listed below, or by using the keyword search tool below to find specific information within the annual report.-
 1
1 -
2
-
3
-
4
-
5
-
6
-
7
-
8
-
9
-
10
-
11
-
12
-
13
-
14
-
15
-
16
-
17
-
18
-
19
-
20
-
21
-
22
-
23
-
24
-
25
-
26
-
27
-
28
-
29
-
30
-
31
-
32
-
33
-
34
-
35
-
36
-
37
-
38
-
39
-
40
-
41
-
42
-
43
-
44
-
45
-
46
-
47
-
48
-
49
-
50
-
51
-
52
-
 53
53 -
 54
54 -
 55
55 -
 56
56 -
 57
57 -
 58
58 -
 59
59 -
 60
60 -
 61
61 -
 62
62 -
 63
63 -
 64
64 -
 65
65 -
 66
66 -
 67
67 -
 68
68 -
 69
69 -
 70
70 -
 71
71 -
 72
72 -
 73
73 -
74
-
75
-
76
-
77
-
78
-
79
-
80
-
81
-
82
-
83
-
84
-
85
-
86
-
87
-
88
-
89
-
90
-
91
-
92
-
93
-
94
-
95
-
96
-
97
-
98
-
99
-
100
-
101
-
102
-
103
-
104
-
105
-
106
-
107
-
108
-
109
-
110
-
111
-
112
-
113
-
114
-
115
-
116
-
117
-
118
-
119
-
120
-
121
-
122
-
123
-
124
-
125
-
126
-
127
 |
 |

61
HSBC BANK CANADA
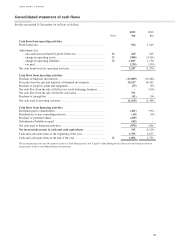
Consolidated statement of cash flows
For the year ended 31 December (in millions of dollars)
Note 2013
$m
2012
$m
Cash flows from operating activities
Prot before tax ............................................................................................. 934 1,029
Adjustments for:
– non-cash items included in prot before tax ........................................ 28 265 203
– change in operating assets .................................................................... 28 (584) (3,311)
– change in operating liabilities .............................................................. 28 1,847 1,150
– tax paid ................................................................................................. (215) (350)
Net cash from/(used in) operating activities ................................................. 2,247 (1,279)
Cash ows from investing activities
Purchase of nancial investments ................................................................. (17,009) (15,682)
Proceeds from the sale and maturity of nancial investments ...................... 15,517 14,423
Purchase of property, plant and equipment ................................................... (37) (55)
Net cash ow from the sale of full service retail brokerage business ........... –(116)
Net cash ow from the sale of held for sale assets ....................................... 371 –
Purchase of intangibles ................................................................................. (11)(14)
Net cash used in investing activities ............................................................. (1,169) (1,444)
Cash ows from nancing activities
Dividends paid to shareholders ..................................................................... (421) (391)
Distributions to non-controlling interests ..................................................... (10) (10)
Purchase of preferred shares ......................................................................... (419) –
Subordinated liabilities repaid ...................................................................... (85) –
Net cash used in nancing activities ............................................................. (935) (401)
Net increase/(decrease) in cash and cash equivalents .............................. 143 (3,124)
Cash and cash equivalents at the beginning of the year ................................ 1,753 4,877
Cash and cash equivalents at the end of the year .......................................... 28 1,896 1,753
The accompanying notes and the audited sections of ‘Risk Management’ and ‘Capital’ within Management’s Discussion and Analysis form an
integral part of these consolidated financial statements.