HSBC 2013 Annual Report Download - page 19
Download and view the complete annual report
Please find page 19 of the 2013 HSBC annual report below. You can navigate through the pages in the report by either clicking on the pages listed below, or by using the keyword search tool below to find specific information within the annual report.-
 1
1 -
2
-
3
-
4
-
5
-
6
-
7
-
8
-
 9
9 -
 10
10 -
 11
11 -
 12
12 -
 13
13 -
 14
14 -
 15
15 -
 16
16 -
 17
17 -
 18
18 -
 19
19 -
 20
20 -
 21
21 -
 22
22 -
 23
23 -
 24
24 -
 25
25 -
 26
26 -
 27
27 -
 28
28 -
 29
29 -
30
-
31
-
32
-
33
-
34
-
35
-
36
-
37
-
38
-
39
-
40
-
41
-
42
-
43
-
44
-
45
-
46
-
47
-
48
-
49
-
50
-
51
-
52
-
53
-
54
-
55
-
56
-
57
-
58
-
59
-
60
-
61
-
62
-
63
-
64
-
65
-
66
-
67
-
68
-
69
-
70
-
71
-
72
-
73
-
74
-
75
-
76
-
77
-
78
-
79
-
80
-
81
-
82
-
83
-
84
-
85
-
86
-
87
-
88
-
89
-
90
-
91
-
92
-
93
-
94
-
95
-
96
-
97
-
98
-
99
-
100
-
101
-
102
-
103
-
104
-
105
-
106
-
107
-
108
-
109
-
110
-
111
-
112
-
113
-
114
-
115
-
116
-
117
-
118
-
119
-
120
-
121
-
122
-
123
-
124
-
125
-
126
-
127
 |
 |

17
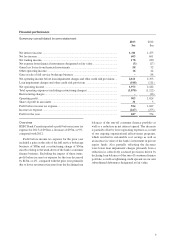
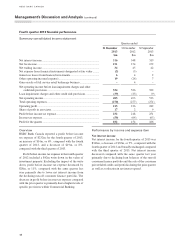
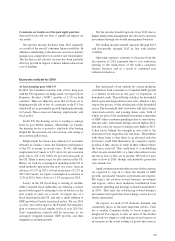
Profit before income tax expense relating to the run-
off consumer finance portfolio was $79m for 2013, an
increase of $14m, or 22%, compared with 2012. Profit
before income tax, relating to the run-off consumer
finance portfolio in 2012, included restructuring charges
of $32m in connection with the wind-down of the
consumer finance business. Excluding the impact of the
restructuring charges, profit before income tax expense
relating to the run-off consumer finance portfolio
decreased by $18m, or 19%, compared with 2012
primarily due to lower interest income from declining
loan balances and the sale of the consumer private
label credit card portfolio. The decrease in profit before
income tax expense relating to the run-off consumer
finance portfolio was partially offset by reductions in
collective provisions and lower operating expenses from
right sizing operations.
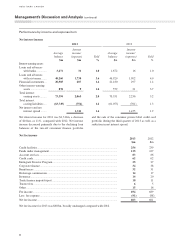
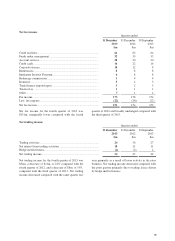
Financial performance by income and expense item
Net interest income relating to ongoing business for
2013 was $360m, a decrease of $22m, or 6%, compared
with 2012 primarily due to a decline in loan balances
and lower net interest spread in a competitive low
interest rate environment.
Net fee income relating to ongoing business for 2013
was $197m, an increase of $3m, or 2%, compared
with 2012 primarily due to growth in funds under
management and related fees.
Net trading income relating to ongoing business
for 2013 was $19m, an increase of $7m, or 58%,
compared with 2012 primarily due to mark to market
gains on structured products and an increase in foreign
exchange activity.
Loan impairment charges and other credit risk
provisions relating to ongoing business for 2013 were
$33m, a decrease of $1m, or 3%, compared with 2012
primarily due lower collective provisions driven by a
decline in loan balances.
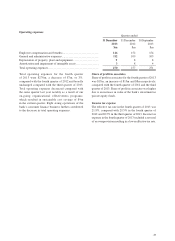
Total operating expenses (excluding restructuring
charges) relating to ongoing business for 2013 were
$501m, a decrease of $19m, or 4%, compared with
2012 primarily as a result of cost control and continued
delivery of our organizational effectiveness programs,
which resulted in sustainable cost savings.
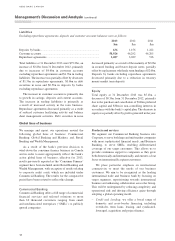
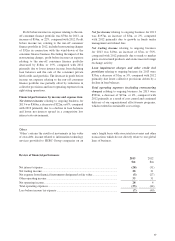
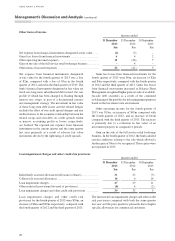
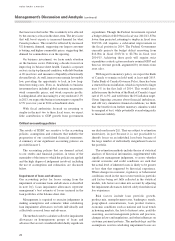
Other
‘Other’ contains the results of movements in fair value
of own debt, income related to information technology
services provided to HSBC Group companies on an
arm’s length basis with associated recoveries and other
transactions which do not directly relate to our global
lines of business.
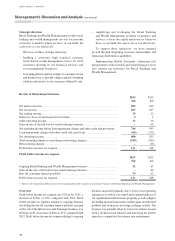
Review of financial performance
2013
$m
2012
$m
Net interest expense ....................................................................................................... (28) (31)
Net trading income ......................................................................................................... 28 31
Net expense from financial instruments designated at fair value .................................. (5) (27)
Other operating income .................................................................................................. 33 31
Net operating income ....................................................................................................... 28 4
Total operating expenses ................................................................................................ (35) (44)
Loss before income tax expense .................................................................................... (7) (40)