Foot Locker 2009 Annual Report Download - page 82
Download and view the complete annual report
Please find page 82 of the 2009 Foot Locker annual report below. You can navigate through the pages in the report by either clicking on the pages listed below, or by using the keyword search tool below to find specific information within the annual report.-
 1
1 -
2
-
3
-
4
-
5
-
6
-
7
-
8
-
9
-
10
-
11
-
12
-
13
-
14
-
15
-
16
-
17
-
18
-
19
-
20
-
21
-
22
-
23
-
24
-
25
-
26
-
27
-
28
-
29
-
30
-
31
-
32
-
33
-
34
-
35
-
36
-
37
-
38
-
39
-
40
-
41
-
42
-
43
-
44
-
45
-
46
-
47
-
48
-
49
-
50
-
51
-
52
-
53
-
54
-
55
-
56
-
57
-
58
-
59
-
60
-
61
-
62
-
63
-
64
-
65
-
66
-
67
-
68
-
69
-
70
-
71
-
 72
72 -
 73
73 -
 74
74 -
 75
75 -
 76
76 -
 77
77 -
 78
78 -
 79
79 -
 80
80 -
 81
81 -
 82
82 -
 83
83 -
 84
84 -
 85
85 -
 86
86 -
 87
87 -
 88
88 -
 89
89 -
 90
90 -
 91
91 -
 92
92 -
93
-
94
-
95
-
96
-
97
-
98
-
99
-
100
 |
 |

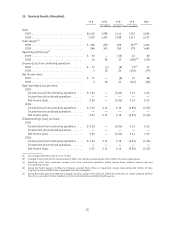
FIVE-YEAR SUMMARY OF SELECTED FINANCIAL DATA
The selected financial data below should be read in conjunction with the Consolidated Financial Statements
and the Notes thereto and other information contained elsewhere in this report.
2009 2008 2007 2006
(1)
2005
($ in millions, except per share amounts)
Summary of Continuing Operations
Sales ................................ $4,854 5,237 5,437 5,750 5,653
Gross margin ........................... 1,332 1,460 1,420 1,736 1,709
Selling, general and administrative expenses ........ 1,099 1,174 1,176 1,163 1,129
Impairment and other charges ................. 41 259 128 17 —
Depreciation and amortization ................ 112 130 166 175 171
Interest expense, net ...................... 10 5 1 3 10
Other income ........................... (3) (8) (1) (14) (6)
Income (loss) from continuing operations .......... 47 (79) 43 247 263
Cumulative effect of accounting change
(2)
......... — — — 1 —
Basic earnings per share from continuing operations . . . 0.30 (0.52) 0.29 1.59 1.70
Basic earnings per share from cumulative effect of
accounting change ...................... — — — 0.01 —
Diluted earnings per share from continuing operations . . 0.30 (0.52) 0.28 1.58 1.67
Diluted earnings per share from cumulative effect of
accounting change ...................... — — — — —
Common stock dividends declared per share ......... 0.60 0.60 0.50 0.40 0.32
Weighted-average common shares outstanding (in
millions) ............................ 156.0 154.0 154.0 155.0 155.1
Weighted-average common shares outstanding assuming
dilution (in millions) ..................... 156.3 154.0 155.6 156.8 157.6
Financial Condition
Cash, cash equivalents and short-term investments .... $ 589 408 493 470 587
Merchandise inventories .................... 1,037 1,120 1,281 1,303 1,254
Property and equipment, net .................. 387 432 521 654 675
Total assets ............................ 2,816 2,877 3,243 3,249 3,312
Long-term debt and obligations under capital leases . . . 138 142 221 234 326
Total shareholders’ equity ................... 1,948 1,924 2,261 2,295 2,027
Financial Ratios
Return on equity (ROE) ..................... 2.4% (3.8) 1.6 11.5 13.6
Operating (loss) profit margin ................. 1.6% (2.0) (0.9) 6.6 7.2
Income (loss) from continuing operations as a percentage
of sales ............................. 1.0% (1.5) 0.8 4.3 4.7
Net debt capitalization percent
(3)
.............. 43.0% 46.7 45.1 44.4 45.2
Current ratio ........................... 4.1 4.2 4.0 3.9 2.8
Other Data
Capital expenditures ...................... $ 89 146 148 165 155
Number of stores at year end ................. 3,500 3,641 3,785 3,942 3,921
Total selling square footage at year end (in millions) . . . 7.74 8.09 8.50 8.74 8.71
Total gross square footage at year end (in millions) .... 12.96 13.50 14.12 14.55 14.48
(1) 2006 represents the 53 weeks ended February 3, 2007.
(2) 2006 relates to the adoption of authoritative accounting guidance for share-based compensation.
(3) Represents total debt, net of cash, cash equivalents and short-term investments and includes the effect of interest rate swaps. The
effect of interest rate swaps increased/(decreased) debt by $18 million, $19 million, $4 million, $(4) million, and $(1) million, at
January 30, 2010, January 31, 2009, February 2, 2008, February 3, 2007, and January 28, 2006, respectively.
64