Foot Locker 2009 Annual Report Download - page 34
Download and view the complete annual report
Please find page 34 of the 2009 Foot Locker annual report below. You can navigate through the pages in the report by either clicking on the pages listed below, or by using the keyword search tool below to find specific information within the annual report.-
 1
1 -
2
-
3
-
4
-
5
-
6
-
7
-
8
-
9
-
10
-
11
-
12
-
13
-
14
-
15
-
16
-
17
-
18
-
19
-
20
-
21
-
22
-
23
-
 24
24 -
 25
25 -
 26
26 -
 27
27 -
 28
28 -
 29
29 -
 30
30 -
 31
31 -
 32
32 -
 33
33 -
 34
34 -
 35
35 -
 36
36 -
 37
37 -
 38
38 -
 39
39 -
 40
40 -
 41
41 -
 42
42 -
 43
43 -
 44
44 -
45
-
46
-
47
-
48
-
49
-
50
-
51
-
52
-
53
-
54
-
55
-
56
-
57
-
58
-
59
-
60
-
61
-
62
-
63
-
64
-
65
-
66
-
67
-
68
-
69
-
70
-
71
-
72
-
73
-
74
-
75
-
76
-
77
-
78
-
79
-
80
-
81
-
82
-
83
-
84
-
85
-
86
-
87
-
88
-
89
-
90
-
91
-
92
-
93
-
94
-
95
-
96
-
97
-
98
-
99
-
100
 |
 |

The effective tax rate for 2008 was a benefit of 20.8 percent as compared with a benefit of 187.0 percent in
2007. The effective income tax rate changed primarily due to the effect of the 2008 goodwill impairment, a
portion of which is not deductible for tax purposes, the 2007 valuation allowance adjustment, and to a lesser
extent, the mix of U.S. and international profits.
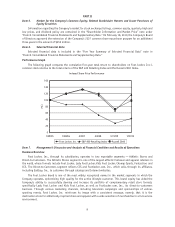
Segment Information
The Company’s two reportable segments, Athletic Stores and Direct-to-Customers, are based on its method of
internal reporting. The Company evaluates performance based on several factors, the primary financial measure of
which is division results. Division profit (loss) reflects income (loss) from continuing operations before income
taxes, corporate expense, non-operating income, and net interest expense. Sales and division results for the
Company’s reportable segments for the years ended January 30, 2010, January 31, 2009 and February 2, 2008 are
presented below.
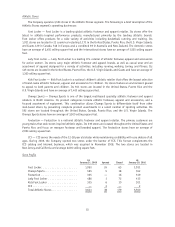
Athletic Stores
2009 2008 2007
(in millions)
Sales ....................................... $4,448 $4,847 $5,071
Division profit (loss) ............................. $ 114 $ (59) $ (27)
Division profit (loss) margin ........................ 2.6% (1.2)% (0.5)%
Number of stores at year end........................ 3,500 3,641 3,785
Selling square footage (in millions) ................... 7.74 8.09 8.50
Gross square footage (in millions) .................... 12.96 13.50 14.12
2009 compared with 2008
Athletic Stores sales of $4,448 million decreased 8.2 percent in 2009, as compared with $4,847 million in
2008. Excluding the effect of foreign currency fluctuations, primarily related to the euro, sales from the Athletic
Stores segment decreased by 7.0 percent in 2009. Comparable-store sales for the Athletic Stores segment
declined 6.2 percent as compared with prior year. The decline in sales for the year ended January 30, 2010 was
primarily related to the domestic operations as the result of a decline in mall traffic and consumer spending in
general. Excluding the effect of foreign currency fluctuations, sales in Europe increased low single digits in 2009
as compared with 2008.
Athletic Stores reported a division profit of $114 million in 2009 as compared with a loss of $59 million in
2008. Included in the results are impairment and other charges of $46 million and $241 million in 2009 and 2008,
respectively. The 2009 results included impairment charges totaling $32 million, which were recorded to write
down long-lived assets such as store fixtures and leasehold improvements at the Company’s Lady Foot Locker,
Kids Foot Locker, Footaction, and Champs Sports divisions for 787 stores. Additionally, in 2009 the Company
recorded a $14 million inventory reserve on certain aged apparel. The 2008 results included a $241 million charge
representing long-lived store asset impairment, goodwill and other intangibles impairment and store closing
costs related to the Company’s U.S. operations. Excluding these charges, division profit decreased $22 million in
2009 as compared with the corresponding prior-year period, which relates primarily to the domestic businesses.
Excluding the effect of foreign currency fluctuations, division profits of international operations were essentially
flat as compared with the corresponding prior-year period.
2008 compared with 2007
Athletic Stores sales of $4,847 million decreased 4.4 percent in 2008, as compared with $5,071 million in
2007. Excluding the effect of foreign currency fluctuations, primarily related to the euro, sales from athletic store
formats decreased by 4.8 percent in 2008. Comparable-store sales for the Athletic Stores segment declined
3.6 percent as compared with prior year. The decline in sales for the year ended January 31, 2009 was primarily
related to the domestic operations as the result of a decline in mall traffic and consumer spending in general.
Excluding the effect of foreign currency fluctuations, sales in Europe decreased low single digits in 2008 as
compared with 2007. The sales of low profile styles negatively affected the first three quarters of 2008. However,
during the fourth quarter of 2008, sales of higher-priced marquee footwear and apparel increased, which more
than offset the sales decline related to the low profile footwear styles.
16