Foot Locker 2009 Annual Report Download - page 81
Download and view the complete annual report
Please find page 81 of the 2009 Foot Locker annual report below. You can navigate through the pages in the report by either clicking on the pages listed below, or by using the keyword search tool below to find specific information within the annual report.-
 1
1 -
2
-
3
-
4
-
5
-
6
-
7
-
8
-
9
-
10
-
11
-
12
-
13
-
14
-
15
-
16
-
17
-
18
-
19
-
20
-
21
-
22
-
23
-
24
-
25
-
26
-
27
-
28
-
29
-
30
-
31
-
32
-
33
-
34
-
35
-
36
-
37
-
38
-
39
-
40
-
41
-
42
-
43
-
44
-
45
-
46
-
47
-
48
-
49
-
50
-
51
-
52
-
53
-
54
-
55
-
56
-
57
-
58
-
59
-
60
-
61
-
62
-
63
-
64
-
65
-
66
-
67
-
68
-
69
-
70
-
 71
71 -
 72
72 -
 73
73 -
 74
74 -
 75
75 -
 76
76 -
 77
77 -
 78
78 -
 79
79 -
 80
80 -
 81
81 -
 82
82 -
 83
83 -
 84
84 -
 85
85 -
 86
86 -
 87
87 -
 88
88 -
 89
89 -
 90
90 -
 91
91 -
92
-
93
-
94
-
95
-
96
-
97
-
98
-
99
-
100
 |
 |

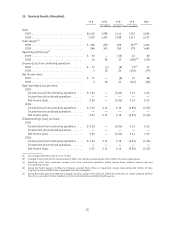
25. Quarterly Results (Unaudited)
1
st
Q2
nd
Q3
rd
Q4
th
Q Year
(in millions, except per share amounts)
Sales
2009.............................. $1,216 1,099 1,214 1,325 4,854
2008 .............................. 1,309 1,302 1,309 1,317 5,237
Gross margin
(a)
2009.............................. $ 356 280 329 367
(b)
1,332
2008 .............................. 366 361 355 378 1,460
Operating profit (loss)
(c)
2009.............................. $ 50 — (10) 40 80
2008 .............................. 16 28 33 (180)
(d)
(103)
Income (loss) from continuing operations
2009.............................. $ 31 (1) (6) 23
(e)
47
2008 .............................. 3 18 24 (124) (79)
Net income (loss)
2009.............................. $ 31 — (6) 23 48
2008 .............................. 3 18 24 (125) (80)
Basic earnings (loss) per share:
2009
Income (loss) from continuing operations . . . $ 0.20 — (0.04) 0.14 0.30
Income from discontinued operations ...... — — — — —
Net income (loss) .................... 0.20 — (0.04) 0.14 0.30
2008
Income (loss) from continuing operations . . . $ 0.02 0.11 0.16 (0.81) (0.52)
Income from discontinued operations ...... — — — — —
Net income (loss) .................... 0.02 0.11 0.16 (0.81) (0.52)
Diluted earnings (loss) per share:
2009
Income (loss) from continuing operations . . . $ 0.20 — (0.04) 0.14 0.30
Income from discontinued operations ...... — — — — —
Net income (loss) .................... 0.20 — (0.04) 0.14 0.30
2008
Income (loss) from continuing operations . . . $ 0.02 0.11 0.16 (0.81) (0.52)
Income from discontinued operations ...... — — — — —
Net income (loss) .................... 0.02 0.11 0.16 (0.81) (0.52)
(a) Gross margin represents sales less cost of sales.
(b) Included in the results for the fourth quarter of 2009 is an inventory reserve charge of $14 million for certain aged apparel.
(c) Operating profit (loss) represents income (loss) from continuing operations before income taxes, interest expense, net and
non-operating income.
(d) During the fourth quarter of 2008, the Company recorded $236 million in impairment charges representing $67 million of store
long-lived assets and $169 million of goodwill and other intangibles.
(e) During the fourth quarter of 2009, the Company recorded a charge of $4 million to reflect the write-down of certain Canadian deferred
tax assets as a result of certain Canadian provincial rate reductions enacted during the quarter.
63