Foot Locker 2009 Annual Report Download - page 39
Download and view the complete annual report
Please find page 39 of the 2009 Foot Locker annual report below. You can navigate through the pages in the report by either clicking on the pages listed below, or by using the keyword search tool below to find specific information within the annual report.-
 1
1 -
2
-
3
-
4
-
5
-
6
-
7
-
8
-
9
-
10
-
11
-
12
-
13
-
14
-
15
-
16
-
17
-
18
-
19
-
20
-
21
-
22
-
23
-
24
-
25
-
26
-
27
-
28
-
 29
29 -
 30
30 -
 31
31 -
 32
32 -
 33
33 -
 34
34 -
 35
35 -
 36
36 -
 37
37 -
 38
38 -
 39
39 -
 40
40 -
 41
41 -
 42
42 -
 43
43 -
 44
44 -
 45
45 -
 46
46 -
 47
47 -
 48
48 -
 49
49 -
50
-
51
-
52
-
53
-
54
-
55
-
56
-
57
-
58
-
59
-
60
-
61
-
62
-
63
-
64
-
65
-
66
-
67
-
68
-
69
-
70
-
71
-
72
-
73
-
74
-
75
-
76
-
77
-
78
-
79
-
80
-
81
-
82
-
83
-
84
-
85
-
86
-
87
-
88
-
89
-
90
-
91
-
92
-
93
-
94
-
95
-
96
-
97
-
98
-
99
-
100
 |
 |

The Company reduced debt by $4 million and increased cash, cash equivalents, and short-term investments
by $181 million during 2009. Additionally, the present value of the operating leases decreased by $29 million
representing the effect of the store closures, offset, in part, by lease renewals and the effect of foreign currency
translation. Including the present value of operating leases, the Company’s net debt capitalization percent
decreased 370 basis points in 2009. The increase in shareholders’ equity of $24 million in 2009 primarily relates
to the following: net income of $48 million, $94 million in dividends paid, $17 million related to stock plans, and
an increase of $65 million in the foreign exchange currency translation adjustment, primarily related to the value
of the euro in relation to the U.S. dollar. In addition, during 2009 the Company recognized, within accumulated
other comprehensive loss, amortization of prior service costs and net actuarial gains and losses, as well as an
additional charge representing the change in the funded status of the pension and postretirement plans, which
totaled $13 million after-tax.
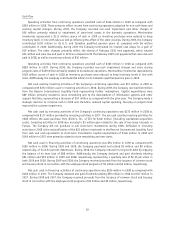
Contractual Obligations and Commitments
The following tables represent the scheduled maturities of the Company’s contractual cash obligations and
other commercial commitments at January 30, 2010:
Payments Due by Period
Contractual Cash Obligations Total Less than
1 Year 2−3
Years 3−5
Years After 5
Years
(in millions)
Long-term debt
(1)
..................... $ 138 $ — $ — $ — $138
Operating leases
(2)
.................... 2,550 487 821 573 669
Other long-term liabilities
(3)
.............. 26 2 — — 24
Total contractual cash obligations.......... $2,714 $489 $821 $573 $831
(1) The amounts presented above represent the contractual maturities of the Company’s long-term debt, excluding interest. Additional
information is included in the ‘‘Long-Term Debt’’ note under ‘‘Item 8. Consolidated Financial Statements and Supplementary Data.’’
(2) The amounts presented represent the future minimum lease payments under non-cancelable operating leases. In addition to minimum
rent, certain of the Company’s leases require the payment of additional costs for insurance, maintenance, and other costs. These costs
have historically represented approximately 25 to 30 percent of the minimum rent amount. These additional amounts are not included
in the table of contractual commitments as the timing and/or amounts of such payments are unknown.
(3) The Company’s other liabilities in the Consolidated Balance Sheet at January 30, 2010 primarily comprise pension and postretirement
benefits, deferred rent liability, income taxes, workers’ compensation and general liability reserves and various other accruals. The
amounts presented in the table are comprised of the Company’s 2010 Canadian qualified plan contributions of $2 million and the
liability related to the European net investment hedge of $24 million. The European net investment agreement includes a provision
that may require the Company to settle this transaction in August 2010, at the option of the Company or the counterparty. This is the
first of a series of annual settlement provisions until August 2015. Other than these liabilities, other amounts (including the Company’s
unrecognized tax benefits of $39 million) have been excluded from the above table as the timing and/or amount of any cash payment is
uncertain. The timing of the remaining amounts that are known has not been included as they are minimal and not useful to the
presentation. Additional information is included in the ‘‘Other Liabilities, Financial Instruments and Risk Management,’’ and
‘‘Retirement Plans and Other Benefits’’ notes under ‘‘Item 8. Consolidated Financial Statements and Supplementary Data.’’
Total
Amounts
Committed
Amount of Commitment Expiration by Period
Other Commercial Commitments Less than
1 Year 2−3
Years 3−5
Years After 5
Years
(in millions)
Unused line of credit
(4)
................. $ 190 $ — $— $190 $—
Standby letters of credit ................ 10 — — 10 —
Purchase commitments
(5)
............... 1,412 1,412 — — —
Other
(6)
........................... 57 28 27 2 —
Total commercial commitments............ $1,669 $1,440 $27 $202 $—
(4) Represents the unused domestic lines of credit pursuant to the Company’s $200 million revolving credit agreement. The Company’s
management currently does not expect to borrow under the facility in 2010.
(5) Represents open purchase orders, as well as other commitments for merchandise purchases, at January 30, 2010. The Company is
obligated under the terms of purchase orders; however, the Company is generally able to renegotiate the timing and quantity of these
orders with certain vendors in response to shifts in consumer preferences.
(6) Represents minimum payments required by non-merchandise purchase agreements.
21