Foot Locker 2009 Annual Report Download - page 50
Download and view the complete annual report
Please find page 50 of the 2009 Foot Locker annual report below. You can navigate through the pages in the report by either clicking on the pages listed below, or by using the keyword search tool below to find specific information within the annual report.-
 1
1 -
2
-
3
-
4
-
5
-
6
-
7
-
8
-
9
-
10
-
11
-
12
-
13
-
14
-
15
-
16
-
17
-
18
-
19
-
20
-
21
-
22
-
23
-
24
-
25
-
26
-
27
-
28
-
29
-
30
-
31
-
32
-
33
-
34
-
35
-
36
-
37
-
38
-
39
-
 40
40 -
 41
41 -
 42
42 -
 43
43 -
 44
44 -
 45
45 -
 46
46 -
 47
47 -
 48
48 -
 49
49 -
 50
50 -
 51
51 -
 52
52 -
 53
53 -
 54
54 -
 55
55 -
 56
56 -
 57
57 -
 58
58 -
 59
59 -
 60
60 -
61
-
62
-
63
-
64
-
65
-
66
-
67
-
68
-
69
-
70
-
71
-
72
-
73
-
74
-
75
-
76
-
77
-
78
-
79
-
80
-
81
-
82
-
83
-
84
-
85
-
86
-
87
-
88
-
89
-
90
-
91
-
92
-
93
-
94
-
95
-
96
-
97
-
98
-
99
-
100
 |
 |

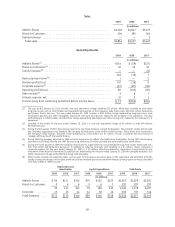
CONSOLIDATED STATEMENTS OF CASH FLOWS
2009 2008 2007
(in millions)
From Operating Activities
Net income (loss) ....................................... $ 48 $ (80) $ 45
Adjustments to reconcile net income (loss) to net cash provided by
operating activities of continuing operations:
Discontinued operations, net of tax .......................... (1) 1 (2)
Non-cash impairment and other charges....................... 36 259 124
Depreciation and amortization ............................. 112 130 166
Share-based compensation expense.......................... 12 9 10
Deferred income taxes................................... 2 (44) (129)
Change in assets and liabilities:
Merchandise inventories ............................... 111 128 55
Accounts payable and other accruals ....................... (7) (43) (36)
Qualified pension plan contributions ....................... (100) (6) —
Income taxes....................................... 9 (7) 14
Gain on termination of interest rate swaps.................... 19 — —
Other, net ......................................... 105 36 36
Net cash provided by operating activities of continuing operations....... 346 383 283
From Investing Activities
Business acquisition ..................................... — (106) —
Gain from lease termination ................................ — 3 1
Gain from insurance recoveries .............................. 1 — 1
Reclassification of cash equivalents to short-term investments ......... — (23) —
Purchases of short-term investments........................... — — (1,378)
Sales of short-term investments .............................. 16 — 1,620
Capital expenditures ..................................... (89) (146) (148)
Proceeds from investment and note ........................... — — 21
Net cash (used in) provided by investing activities of continuing operations (72) (272) 117
From Financing Activities
Reduction in long-term debt ................................ (3) (94) (7)
Repayment of capital lease ................................. — — (14)
Dividends paid on common stock ............................. (94) (93) (77)
Issuance of common stock ................................. 3 2 9
Purchase of treasury shares ................................. — — (50)
Tax benefit on stock compensation............................ — — 1
Net cash used in financing activities of continuing operations.......... (94) (185) (138)
Effect of Exchange Rate Fluctuations on Cash and Cash Equivalents .... 18 (29) 5
Net Cash used by Discontinued Operations ..................... (1) — —
Net Change in Cash and Cash Equivalents ...................... 197 (103) 267
Cash and Cash Equivalents at Beginning of Year .................. 385 488 221
Cash and Cash Equivalents at End of Year....................... $582 $385 $ 488
Cash Paid During the Year:
Interest ............................................ $ 12 $ 11 $ 18
Income taxes ........................................ $ 19 $ 64 $ 52
See Accompanying Notes to Consolidated Financial Statements.
32