Foot Locker 2009 Annual Report Download - page 32
Download and view the complete annual report
Please find page 32 of the 2009 Foot Locker annual report below. You can navigate through the pages in the report by either clicking on the pages listed below, or by using the keyword search tool below to find specific information within the annual report.-
 1
1 -
2
-
3
-
4
-
5
-
6
-
7
-
8
-
9
-
10
-
11
-
12
-
13
-
14
-
15
-
16
-
17
-
18
-
19
-
20
-
21
-
 22
22 -
 23
23 -
 24
24 -
 25
25 -
 26
26 -
 27
27 -
 28
28 -
 29
29 -
 30
30 -
 31
31 -
 32
32 -
 33
33 -
 34
34 -
 35
35 -
 36
36 -
 37
37 -
 38
38 -
 39
39 -
 40
40 -
 41
41 -
 42
42 -
43
-
44
-
45
-
46
-
47
-
48
-
49
-
50
-
51
-
52
-
53
-
54
-
55
-
56
-
57
-
58
-
59
-
60
-
61
-
62
-
63
-
64
-
65
-
66
-
67
-
68
-
69
-
70
-
71
-
72
-
73
-
74
-
75
-
76
-
77
-
78
-
79
-
80
-
81
-
82
-
83
-
84
-
85
-
86
-
87
-
88
-
89
-
90
-
91
-
92
-
93
-
94
-
95
-
96
-
97
-
98
-
99
-
100
 |
 |

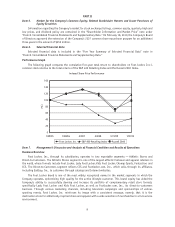
Sales of $5,237 million in 2008 decreased by 3.7 percent from sales of $5,437 million in 2007. Excluding the
effect of foreign currency fluctuations, sales declined 4.0 percent as compared with 2007. Comparable-store sales
decreased by 3.2 percent.
Gross Margin
Gross margin as a percentage of sales was 27.4 percent in 2009 decreasing 50 basis points as compared with
2008. The decrease in the gross margin reflected an increase of 30 basis points in the merchandise margin rate
due to lower markdowns, offset by an 80 basis point increase in the occupancy rate due to lower sales. Vendor
allowances were essentially the same as compared with 2008 and did not significantly affect the gross margin
rate. During the fourth quarter of 2009, the Company recorded a $14 million inventory reserve on certain aged
apparel as part of its new apparel strategy. Excluding this charge, gross margin would have declined by 20 basis
points as compared with 2008.
Gross margin as a percentage of sales was 27.9 percent in 2008 increasing 180 basis points as compared with
2007. The increase in the gross margin represented an increase of 230 basis points in the merchandise margin
rate reflecting lower markdowns. Lower sales in 2008 resulted in the occupancy rate increasing by 50 basis
points, as a percentage of sales. The effect of reduced vendor allowances was not significant as compared with
2007.
Selling, General and Administrative Expenses
Selling, general and administrative (‘‘SG&A’’) expenses decreased by $75 million to $1,099 million in 2009, or
by 6.4 percent, as compared with 2008. SG&A as a percentage of sales increased to 22.6 percent as compared with
22.4 percent in 2008, due to the decline in sales. Excluding the effect of foreign currency fluctuations in 2009,
SG&A decreased by $64 million. This decrease reflects lower divisional expenses primarily due to operating fewer
stores and compensation expense, offset, in part, by increased pension expense of $13 million.
SG&A expenses decreased by $2 million to $1,174 million in 2008, or by 0.2 percent, as compared with 2007.
SG&A as a percentage of sales increased to 22.4 percent as compared with 21.6 percent in 2007. The increase in
SG&A as a percentage of sales is due to the decline in sales. Excluding the effect of foreign currency fluctuations
in 2008, SG&A decreased by $9 million. This decrease reflects lower divisional expenses due to operating fewer
stores, offset, in part, by an increase in corporate expenses primarily related to increased incentive compensation.
Corporate Expense
Corporate expense consists of unallocated general and administrative expenses as well as depreciation and
amortization related to the Company’s corporate headquarters, centrally managed departments, unallocated
insurance and benefit programs, certain foreign exchange transaction gains and losses, and other items.
Corporate expense decreased by $20 million to $67 million in 2009 as compared with 2008. Depreciation and
amortization included in corporate expense was $13 million in both 2009 and 2008. Included in 2008 corporate
expense were charges that totaled $18 million, which represented a $3 million other-than-temporary impairment
charge related to a short-term investment and a $15 million impairment charge related to the Northern Group
note receivable. The balance of the change represents lower incentive compensation costs as well as income of
$3 million related to the final settlement of the Visa/MasterCard litigation. These reductions in corporate
expense were offset, in part, by higher pension expense.
Corporate expense increased by $28 million to $87 million in 2008 as compared with 2007. Depreciation and
amortization included in corporate expense amounted to $13 million in 2008 and $14 million in 2007. As noted
above, corporate expense for 2008 included a $3 million other-than-temporary impairment charge related to a
short-term investment and a $15 million impairment charge related to the Northern Group note receivable.
During the first quarter of 2008, the principal owners of the Northern Group requested an extension on the
repayment of the note, which was scheduled to be repaid on September 28, 2008. The Company determined, based
on the Northern Group’s current financial condition and projected performance, that repayment of the note
pursuant to the original terms of the purchase agreement was not likely. Excluding these charges, corporate
expense increased by $10 million, which is primarily related to increased incentive compensation.
14