Foot Locker 2009 Annual Report Download - page 35
Download and view the complete annual report
Please find page 35 of the 2009 Foot Locker annual report below. You can navigate through the pages in the report by either clicking on the pages listed below, or by using the keyword search tool below to find specific information within the annual report.-
 1
1 -
2
-
3
-
4
-
5
-
6
-
7
-
8
-
9
-
10
-
11
-
12
-
13
-
14
-
15
-
16
-
17
-
18
-
19
-
20
-
21
-
22
-
23
-
24
-
 25
25 -
 26
26 -
 27
27 -
 28
28 -
 29
29 -
 30
30 -
 31
31 -
 32
32 -
 33
33 -
 34
34 -
 35
35 -
 36
36 -
 37
37 -
 38
38 -
 39
39 -
 40
40 -
 41
41 -
 42
42 -
 43
43 -
 44
44 -
 45
45 -
46
-
47
-
48
-
49
-
50
-
51
-
52
-
53
-
54
-
55
-
56
-
57
-
58
-
59
-
60
-
61
-
62
-
63
-
64
-
65
-
66
-
67
-
68
-
69
-
70
-
71
-
72
-
73
-
74
-
75
-
76
-
77
-
78
-
79
-
80
-
81
-
82
-
83
-
84
-
85
-
86
-
87
-
88
-
89
-
90
-
91
-
92
-
93
-
94
-
95
-
96
-
97
-
98
-
99
-
100
 |
 |

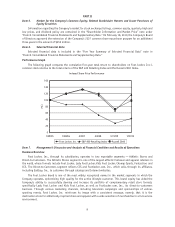
Athletic Stores reported a loss of $59 million in 2008 as compared with a loss of $27 million in 2007, which
was primarily attributable to the U.S. operations. Included in the results for 2008 and 2007 are impairment
charges and store closing costs totaling $241 million and $128 million, respectively. Athletic Stores division loss
for 2008 includes a $167 million goodwill impairment charge, a $67 million write-down of long-lived assets such
as store fixtures and leasehold improvements for 868 stores at the Company’s U.S. store operations, $5 million of
exit costs related to the closure of underperforming stores comprising primarily lease terminations and $2 million
in other intangible impairment charges related to its tradenames. The Company performs its annual impairment
test as of the beginning of each year; however, due to the macroeconomic conditions affecting retail and the
significant decline in the Company’s common stock and market capitalization, plus a reasonable control premium,
in relation to the book value, the Company determined that a triggering event had occurred and, therefore,
performed an interim impairment test.
During 2008, the fair value of the four reporting units containing goodwill was determined under step 1 of
the goodwill impairment test based on a weighting of a discounted cash flow analysis using forward-looking
projections of estimated future operating results and a guideline company methodology under the market
approach. Based on this testing, the Company determined that the fair values, as determined under step 1 as
described above, was less than the carrying values of the Foot Locker, Kids Foot Locker and Footaction reporting
unit and the Champs Sports reporting unit. Accordingly, the Company performed a step 2 analysis to determine
the extent of the goodwill impairment and concluded that the goodwill of these two reporting units was fully
impaired, resulting in a non-cash impairment charge of $167 million. There were no goodwill impairment charges
in 2007. Excluding the impairment charges and store exit costs from both 2008 and 2007, division profit would
have increased to $182 million in 2008 from $101 million in 2007. This increase in division profit primarily
related to the domestic divisions as a result of lower promotional markdowns and reduced depreciation and
amortization expense.
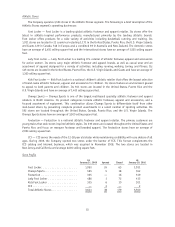
Direct-to-Customers
2009 2008 2007
(in millions)
Sales ....................................... $406 $ 390 $ 364
Division profit ................................. $ 32 $ 43 $ 40
Division profit margin ............................ 7.9% 11.0% 11.0%
2009 compared with 2008
Direct-to-Customers sales increased 4.1 percent to $406 million in 2009, as compared with $390 million in
2008, reflecting a comparable-store sales decrease of 6.8 percent, offset by additional sales from CCS, which was
acquired during the fourth quarter of 2008. Internet sales increased by 6.8 percent to $344 million, as compared
with 2008 reflecting continued growth in the store brands’ websites. Catalog sales decreased by 8.8 percent to
$62 million in 2009 from $68 million in 2008. Management believes that the decrease in catalog sales, which was
substantially offset by the increase in Internet sales, is a result of customers browsing and selecting products
through its catalogs and then making their purchases via the Internet.
The Direct-to-Customers business generated division profit of $32 million in 2009, as compared with
$43 million in 2008. Division profit, as a percentage of sales, was 7.9 percent in 2009 and 11.0 percent in 2008.
Included in division profit is a $4 million impairment charge, which was recorded to write off certain software
development costs as a result of management’s decision to terminate the project. Gross margin was negatively
affected by the lack of close-out inventory purchases during the year. Additionally, division profit, as compared
with the corresponding prior-year period, was negatively affected by $3 million in additional amortization
expense related to the CCS customer list intangible asset.
17