Foot Locker 2009 Annual Report Download - page 70
Download and view the complete annual report
Please find page 70 of the 2009 Foot Locker annual report below. You can navigate through the pages in the report by either clicking on the pages listed below, or by using the keyword search tool below to find specific information within the annual report.-
 1
1 -
2
-
3
-
4
-
5
-
6
-
7
-
8
-
9
-
10
-
11
-
12
-
13
-
14
-
15
-
16
-
17
-
18
-
19
-
20
-
21
-
22
-
23
-
24
-
25
-
26
-
27
-
28
-
29
-
30
-
31
-
32
-
33
-
34
-
35
-
36
-
37
-
38
-
39
-
40
-
41
-
42
-
43
-
44
-
45
-
46
-
47
-
48
-
49
-
50
-
51
-
52
-
53
-
54
-
55
-
56
-
57
-
58
-
59
-
 60
60 -
 61
61 -
 62
62 -
 63
63 -
 64
64 -
 65
65 -
 66
66 -
 67
67 -
 68
68 -
 69
69 -
 70
70 -
 71
71 -
 72
72 -
 73
73 -
 74
74 -
 75
75 -
 76
76 -
 77
77 -
 78
78 -
 79
79 -
 80
80 -
81
-
82
-
83
-
84
-
85
-
86
-
87
-
88
-
89
-
90
-
91
-
92
-
93
-
94
-
95
-
96
-
97
-
98
-
99
-
100
 |
 |

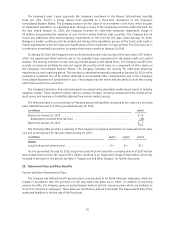
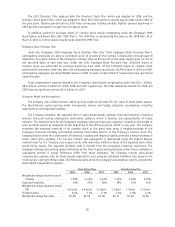
Interest Rate Risk Management
The Company historically has employed various interest rate swaps to minimize its exposure to interest rate
fluctuations. On March 20, 2009, the Company terminated its interest rate swaps for a gain of $19 million. This
gain will be amortized as part of interest expense over the remaining term of the debt using the effective-yield
method. The amount amortized during 2009 was $1 million.
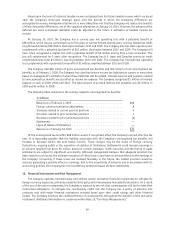
Business Risk
The retailing business is highly competitive. Price, quality, selection of merchandise, reputation, store
location, advertising and customer service are important competitive factors in the Company’s business. The
Company operates in 21 countries and purchased approximately 82 percent of its merchandise in 2009 from its
top 5 vendors. In 2009, the Company purchased approximately 68 percent of its athletic merchandise from one
major vendor and approximately 8 percent from another major vendor. Each of our operating divisions is highly
dependent on Nike; they individually purchase 46 to 85 percent of their merchandise from Nike. The Company
generally considers all vendor relations to be satisfactory.
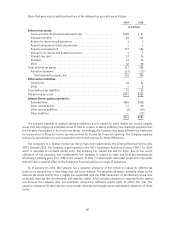
Included in the Company’s Consolidated Balance Sheet at January 30, 2010, are the net assets of the
Company’s European operations, which total $658 million and which are located in 17 countries, 11 of which have
adopted the euro as their functional currency.
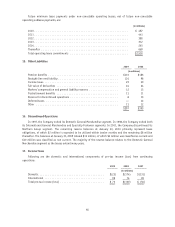
Fair Value of Financial Instruments
The carrying value and estimated fair value of long-term debt was $138 million and $127 million,
respectively, at January 30, 2010 and $142 million and $120 million, respectively, at January 31, 2009. The
carrying values of cash and cash equivalents and other current receivables and payables approximate their fair
value due to the short-term nature of these assets and liabilities.
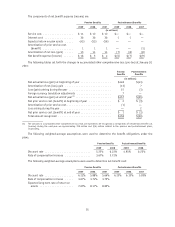
19. Fair Value Measurements
The following table provides a summary of the recognized assets and liabilities that are measured at fair
value on a recurring basis: As of January 30, 2010
(in millions) Level 1 Level 2 Level 3 Total
Assets
Short-term investment ..................... $— $— $ 7 $ 7
Auction rate security ...................... — 5 — 5
Forward foreign exchange contracts ............ — 1 — 1
Total Assets ............................ $— $ 6 $ 7 $13
Liabilities
European net investment hedge ............... — 24 — 24
Total Liabilities .......................... $— $24 $— $24
As of January 31, 2009
(in millions) Level 1 Level 2 Level 3 Total
Assets
Short-term investment ..................... $— $— $23 $23
Auction rate security ...................... — 2 — 2
Forward foreign exchange contracts ............ — 5 — 5
Interest rate swaps ....................... — 19 — 19
Total Assets ............................ $— $26 $23 $49
Liabilities
Forward foreign exchange contracts ............ — 1 — 1
European net investment hedge ............... — 24 — 24
Total Liabilities .......................... $— $25 $— $25
52