Experian 2012 Annual Report Download - page 94
Download and view the complete annual report
Please find page 94 of the 2012 Experian annual report below. You can navigate through the pages in the report by either clicking on the pages listed below, or by using the keyword search tool below to find specific information within the annual report.-
 1
1 -
2
-
3
-
4
-
5
-
6
-
7
-
8
-
9
-
10
-
11
-
12
-
13
-
14
-
15
-
16
-
17
-
18
-
19
-
20
-
21
-
22
-
23
-
24
-
25
-
26
-
27
-
28
-
29
-
30
-
31
-
32
-
33
-
34
-
35
-
36
-
37
-
38
-
39
-
40
-
41
-
42
-
43
-
44
-
45
-
46
-
47
-
48
-
49
-
50
-
51
-
52
-
53
-
54
-
55
-
56
-
57
-
58
-
59
-
60
-
61
-
62
-
63
-
64
-
65
-
66
-
67
-
68
-
69
-
70
-
71
-
72
-
73
-
74
-
75
-
76
-
77
-
78
-
79
-
80
-
81
-
82
-
83
-
 84
84 -
 85
85 -
 86
86 -
 87
87 -
 88
88 -
 89
89 -
 90
90 -
 91
91 -
 92
92 -
 93
93 -
 94
94 -
 95
95 -
 96
96 -
 97
97 -
 98
98 -
 99
99 -
 100
100 -
 101
101 -
 102
102 -
 103
103 -
 104
104 -
105
-
106
-
107
-
108
-
109
-
110
-
111
-
112
-
113
-
114
-
115
-
116
-
117
-
118
-
119
-
120
-
121
-
122
-
123
-
124
-
125
-
126
-
127
-
128
-
129
-
130
-
131
-
132
-
133
-
134
-
135
-
136
-
137
-
138
-
139
-
140
-
141
-
142
-
143
-
144
-
145
-
146
-
147
-
148
-
149
-
150
-
151
-
152
-
153
-
154
-
155
-
156
-
157
-
158
-
159
-
160
-
161
-
162
-
163
-
164
 |
 |

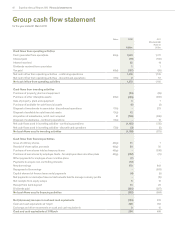
92 Experian Annual Report 2012 Financial statements
Group cash flow statement
for the year ended 31 March 2012
Notes 2012
US$m
2011
(Re-presented)
(Note 3)
US$m
Cash flows from operating activities
Cash generated from operations 40(a) 1,539 1,311
Interest paid (79) (106)
Interest received 22 14
Dividends received from associates 1 1
Tax paid 40(d) (107) (85)
Net cash inflow from operating activities - continuing operations 1,376 1,135
Net cash inflow from operating activities - discontinued operations 17(b) 2 57
Net cash inflow from operating activities 1,378 1,192
Cash flows from investing activities
Purchase of property, plant and equipment (84) (69)
Purchase of other intangible assets 40(e) (369) (300)
Sale of property, plant and equipment 37
Purchase of available for sale financial assets (1) (3)
Disposal of investments in associates - discontinued operations 17(b) - 279
Disposal of available for sale financial assets 13(a) 12 -
Acquisition of subsidiaries, net of cash acquired 41 (746) (296)
Disposal of subsidiaries - continuing operations 13(a) -12
Net cash flows used in investing activities - continuing operations (1,185) (370)
Net cash flows used in investing activities - discontinued operations 17(b) (3) (5)
Net cash flows used in investing activities (1,188) (375)
Cash flows from financing activities
Issue of ordinary shares 40(g) 11 7
Receipt of share option proceeds 40(g) 54 50
Purchase of own shares held as treasury shares 40(g) - (336)
Purchase of own shares by employee trusts - for employee share incentive plans 40(g) (232) (70)
Other payments for employee share incentive plans (7) -
Payments to acquire non-controlling interests (12) -
New borrowings 179 643
Repayment of borrowings - (593)
Capital element of finance lease rental payments (4) (5)
Net payments on derivative financial instruments held to manage currency profile - (15)
Net receipts from equity swaps 5 13
Receipt from bank deposit 14 29
Dividends paid (361) (307)
Net cash flows used in financing activities (353) (584)
Net (decrease)/increase in cash and cash equivalents (163) 233
Cash and cash equivalents at 1 April 408 163
Exchange and other movements on cash and cash equivalents 9 12
Cash and cash equivalents at 31 March 254 408