Experian 2012 Annual Report Download - page 32
Download and view the complete annual report
Please find page 32 of the 2012 Experian annual report below. You can navigate through the pages in the report by either clicking on the pages listed below, or by using the keyword search tool below to find specific information within the annual report.-
 1
1 -
2
-
3
-
4
-
5
-
6
-
7
-
8
-
9
-
10
-
11
-
12
-
13
-
14
-
15
-
16
-
17
-
18
-
19
-
20
-
21
-
 22
22 -
 23
23 -
 24
24 -
 25
25 -
 26
26 -
 27
27 -
 28
28 -
 29
29 -
 30
30 -
 31
31 -
 32
32 -
 33
33 -
 34
34 -
 35
35 -
 36
36 -
 37
37 -
 38
38 -
 39
39 -
 40
40 -
 41
41 -
 42
42 -
43
-
44
-
45
-
46
-
47
-
48
-
49
-
50
-
51
-
52
-
53
-
54
-
55
-
56
-
57
-
58
-
59
-
60
-
61
-
62
-
63
-
64
-
65
-
66
-
67
-
68
-
69
-
70
-
71
-
72
-
73
-
74
-
75
-
76
-
77
-
78
-
79
-
80
-
81
-
82
-
83
-
84
-
85
-
86
-
87
-
88
-
89
-
90
-
91
-
92
-
93
-
94
-
95
-
96
-
97
-
98
-
99
-
100
-
101
-
102
-
103
-
104
-
105
-
106
-
107
-
108
-
109
-
110
-
111
-
112
-
113
-
114
-
115
-
116
-
117
-
118
-
119
-
120
-
121
-
122
-
123
-
124
-
125
-
126
-
127
-
128
-
129
-
130
-
131
-
132
-
133
-
134
-
135
-
136
-
137
-
138
-
139
-
140
-
141
-
142
-
143
-
144
-
145
-
146
-
147
-
148
-
149
-
150
-
151
-
152
-
153
-
154
-
155
-
156
-
157
-
158
-
159
-
160
-
161
-
162
-
163
-
164
 |
 |

30 Experian Annual Report 2012 Business review
Chief Executive’s review continued
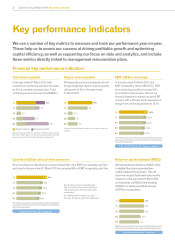
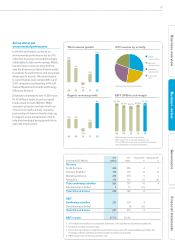
Revenue and EBIT by geography
Revenue EBIT
Year ended 31 March
2012
US$m
20111
US$m
Growth2
%
2012
US$m
20111
US$m
Growth2
%
North America 2,092 1,905 10 658 556 18
Latin America 961 722 31 320 235 34
UK and Ireland 824 731 10 227 214 4
EMEA/Asia Pacific 608 501 17 44 52 (16)
Sub total 4,485 3,859 15 1,249 1,057 17
Central Activities3-- - (74) (66) -
Continuing activities 4,485 3,859 15 1,175 991 18
Discontinuing activities4226 n/a -- -
Total 4,487 3,885 14 1,175 991 18
EBIT margin526.2% 25.7%
1. 2011 restated to exclude comparison shopping and lead generation businesses in North America and UK and Ireland; these have been classified as discontinued
operations.
2. Total growth at constant exchange rates.
3. Central Activities comprise costs of central corporate functions.
4. Discontinuing activities include UK account processing, some UK hosted database activities, UK mortgage software activities and other smaller discontinuing activities
(principally in EMEA/Asia Pacific).
5. EBIT margin is for continuing business only. Further analysis can be found in the financial review on page 46.
Income statement and earnings analysis
2012
US$m
2011
US$m
EBIT from continuing operations 1,175 991
Net interest (47) (71)
Benchmark PBT 1,128 920
Exceptional items 12 (2)
Amortisation of acquisition intangibles (122) (99)
Acquisition expenses (9) (8)
Adjustment to the fair value of contingent consideration 3-
Charges for demerger-related equity incentive plans (5) (13)
Financing fair value remeasurements (318) (142)
Profit before tax 689 656
Group tax credit/(charge) 35 (118)
Profit after tax from continuing operations 724 538
Benchmark EPS (US cents) 78.9 66.9
Basic EPS for continuing operations (US cents) 66.8 49.4
Weighted average number of ordinary shares (million) 989 1,002
See page 46 for analysis of revenue and EBIT by business segment.
See the financial review on pages 40 to 46, and note 7 to the Group financial statements for definitions of
non-GAAP measures.