Experian 2012 Annual Report Download - page 137
Download and view the complete annual report
Please find page 137 of the 2012 Experian annual report below. You can navigate through the pages in the report by either clicking on the pages listed below, or by using the keyword search tool below to find specific information within the annual report.-
 1
1 -
2
-
3
-
4
-
5
-
6
-
7
-
8
-
9
-
10
-
11
-
12
-
13
-
14
-
15
-
16
-
17
-
18
-
19
-
20
-
21
-
22
-
23
-
24
-
25
-
26
-
27
-
28
-
29
-
30
-
31
-
32
-
33
-
34
-
35
-
36
-
37
-
38
-
39
-
40
-
41
-
42
-
43
-
44
-
45
-
46
-
47
-
48
-
49
-
50
-
51
-
52
-
53
-
54
-
55
-
56
-
57
-
58
-
59
-
60
-
61
-
62
-
63
-
64
-
65
-
66
-
67
-
68
-
69
-
70
-
71
-
72
-
73
-
74
-
75
-
76
-
77
-
78
-
79
-
80
-
81
-
82
-
83
-
84
-
85
-
86
-
87
-
88
-
89
-
90
-
91
-
92
-
93
-
94
-
95
-
96
-
97
-
98
-
99
-
100
-
101
-
102
-
103
-
104
-
105
-
106
-
107
-
108
-
109
-
110
-
111
-
112
-
113
-
114
-
115
-
116
-
117
-
118
-
119
-
120
-
121
-
122
-
123
-
124
-
125
-
126
-
 127
127 -
 128
128 -
 129
129 -
 130
130 -
 131
131 -
 132
132 -
 133
133 -
 134
134 -
 135
135 -
 136
136 -
 137
137 -
 138
138 -
 139
139 -
 140
140 -
 141
141 -
 142
142 -
 143
143 -
 144
144 -
 145
145 -
 146
146 -
 147
147 -
148
-
149
-
150
-
151
-
152
-
153
-
154
-
155
-
156
-
157
-
158
-
159
-
160
-
161
-
162
-
163
-
164
 |
 |

135
Governance Financial statementsBusiness reviewBusiness overview
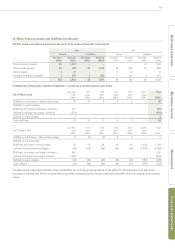
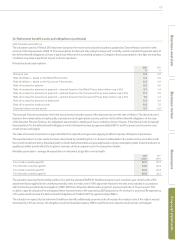
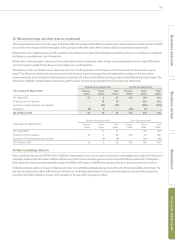
34. Retirement benefit assets and obligations (continued)
(ii) Movements in net retirement benefit assets recognised in the Group balance sheet
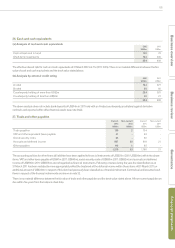
2012
US$m
2011
US$m
At 1 April 55 (88)
Differences on exchange -1
Income recognised in Group income statement 225
Actuarial gains recognised within other comprehensive income 9107
Contributions paid by the Group 11 10
At 31 March 77 55
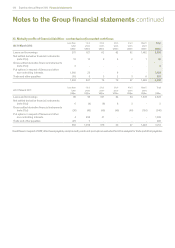
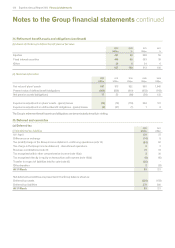
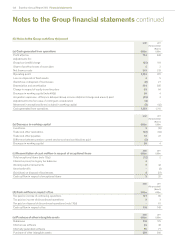
(iii) Present value of the total defined benefit obligations
Movements in the year
2012
US$m
2011
US$m
At 1 April 858 910
Differences on exchange (3) 48
Current service cost 910
Credit in respect of past service costs -(29)
Interest on plans’ liabilities 46 50
Actuarial losses/(gains) on liabilities 7(97)
Contributions paid by employees 44
Benefits paid (41) (38)
At 31 March 880 858
Analysis of the present value of the total defined benefit obligations
2012
US$m
2011
US$m
Funded arrangements 827 807
Unfunded arrangements 53 51
At 31 March 880 858
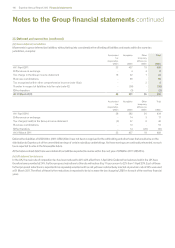
(iv) Movements in the fair value of the plans’ assets
2012
US$m
2011
US$m
At 1 April 913 822
Differences on exchange (3) 49
Expected return on plans’ assets 57 56
Actuarial gains on assets 16 10
Actual return on plans’ assets 73 66
Contributions paid by the Group 11 10
Contributions paid by employees 4 4
Benefits paid (41) (38)
At 31 March 957 913