Experian 2012 Annual Report Download - page 35
Download and view the complete annual report
Please find page 35 of the 2012 Experian annual report below. You can navigate through the pages in the report by either clicking on the pages listed below, or by using the keyword search tool below to find specific information within the annual report.-
 1
1 -
2
-
3
-
4
-
5
-
6
-
7
-
8
-
9
-
10
-
11
-
12
-
13
-
14
-
15
-
16
-
17
-
18
-
19
-
20
-
21
-
22
-
23
-
24
-
 25
25 -
 26
26 -
 27
27 -
 28
28 -
 29
29 -
 30
30 -
 31
31 -
 32
32 -
 33
33 -
 34
34 -
 35
35 -
 36
36 -
 37
37 -
 38
38 -
 39
39 -
 40
40 -
 41
41 -
 42
42 -
 43
43 -
 44
44 -
 45
45 -
46
-
47
-
48
-
49
-
50
-
51
-
52
-
53
-
54
-
55
-
56
-
57
-
58
-
59
-
60
-
61
-
62
-
63
-
64
-
65
-
66
-
67
-
68
-
69
-
70
-
71
-
72
-
73
-
74
-
75
-
76
-
77
-
78
-
79
-
80
-
81
-
82
-
83
-
84
-
85
-
86
-
87
-
88
-
89
-
90
-
91
-
92
-
93
-
94
-
95
-
96
-
97
-
98
-
99
-
100
-
101
-
102
-
103
-
104
-
105
-
106
-
107
-
108
-
109
-
110
-
111
-
112
-
113
-
114
-
115
-
116
-
117
-
118
-
119
-
120
-
121
-
122
-
123
-
124
-
125
-
126
-
127
-
128
-
129
-
130
-
131
-
132
-
133
-
134
-
135
-
136
-
137
-
138
-
139
-
140
-
141
-
142
-
143
-
144
-
145
-
146
-
147
-
148
-
149
-
150
-
151
-
152
-
153
-
154
-
155
-
156
-
157
-
158
-
159
-
160
-
161
-
162
-
163
-
164
 |
 |

33
GovernanceBusiness reviewBusiness overview Financial statements
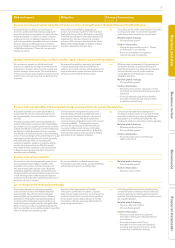
Social, ethical and
environmental performance
Employees have again been generous
with their time and money, volunteering
more hours and raising more funds than
in any prior year. The linkage between the
community programme and consumer
education initiatives has led to some very
positive outcomes; this year our Experian
North America Public Education leader
was appointed to represent a national
coalition of 150 organisations dedicated to
financial education.
The region contributes 57% of the Group’s
carbon footprint and reduced its overall
carbon impact through energy savings
in buildings and data centres, although
carbon attributed to travel increased.
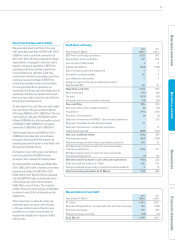
Year ended 31 March
2012
US$m
20111
US$m
Total grow th2
%
Organic growth
2
%
Revenue
Credit Services 791 716 10 7
Decision Analytics 129 113 14 14
Marketing Services 395 367 8 8
Interactive 777 709 10 3
Total North America 2,092 1,905 10 6
EBIT
Total North America 658 556 18
EBIT margin 31.5% 29.2%
1. 2011 restated to exclude price comparison and lead generation businesses, now classified as
discontinued operations.
2. Growth at constant exchange rates.
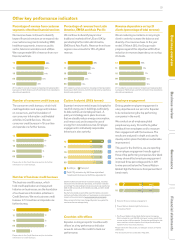
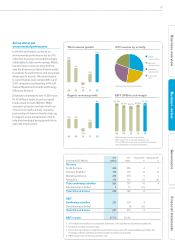
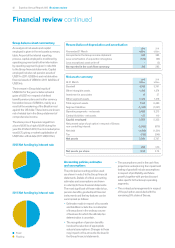
08 09 10 11 12
08 09 10 11 12
08 09 10 11 12
Organic revenue growth EBIT (US$m) and margin
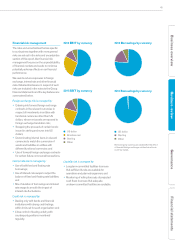
Total revenue growth 2012 revenue by activity
2011 restated to exclude price comparison and
lead generation businesses, now classified as
discontinued operations.
3%
1%
0%
7%
6% 26.9%
554
27.9%
575
27.8%
572
29.2%
556
31.5%
658
4%
1% 0%
9%
10%
Credit
Services 38%
Decision
Analytics 6%
Marketing
Services 19%
Interactive
37%