Experian 2012 Annual Report Download - page 42
Download and view the complete annual report
Please find page 42 of the 2012 Experian annual report below. You can navigate through the pages in the report by either clicking on the pages listed below, or by using the keyword search tool below to find specific information within the annual report.-
 1
1 -
2
-
3
-
4
-
5
-
6
-
7
-
8
-
9
-
10
-
11
-
12
-
13
-
14
-
15
-
16
-
17
-
18
-
19
-
20
-
21
-
22
-
23
-
24
-
25
-
26
-
27
-
28
-
29
-
30
-
31
-
 32
32 -
 33
33 -
 34
34 -
 35
35 -
 36
36 -
 37
37 -
 38
38 -
 39
39 -
 40
40 -
 41
41 -
 42
42 -
 43
43 -
 44
44 -
 45
45 -
 46
46 -
 47
47 -
 48
48 -
 49
49 -
 50
50 -
 51
51 -
 52
52 -
53
-
54
-
55
-
56
-
57
-
58
-
59
-
60
-
61
-
62
-
63
-
64
-
65
-
66
-
67
-
68
-
69
-
70
-
71
-
72
-
73
-
74
-
75
-
76
-
77
-
78
-
79
-
80
-
81
-
82
-
83
-
84
-
85
-
86
-
87
-
88
-
89
-
90
-
91
-
92
-
93
-
94
-
95
-
96
-
97
-
98
-
99
-
100
-
101
-
102
-
103
-
104
-
105
-
106
-
107
-
108
-
109
-
110
-
111
-
112
-
113
-
114
-
115
-
116
-
117
-
118
-
119
-
120
-
121
-
122
-
123
-
124
-
125
-
126
-
127
-
128
-
129
-
130
-
131
-
132
-
133
-
134
-
135
-
136
-
137
-
138
-
139
-
140
-
141
-
142
-
143
-
144
-
145
-
146
-
147
-
148
-
149
-
150
-
151
-
152
-
153
-
154
-
155
-
156
-
157
-
158
-
159
-
160
-
161
-
162
-
163
-
164
 |
 |

40 Experian Annual Report 2012 Business review
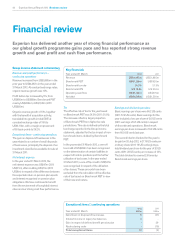
Group income statement commentary
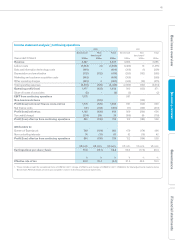
Revenue and profit performance –
continuing operations
Revenue increased from US$3,885m in the
prior year to US$4,487m in the year ended
31 March 2012. At constant exchange rates,
organic revenue growth was 10%.
Profit before tax increased by 5%, from
US$656m to US$689m. Benchmark PBT
rose by US$208m to US$1,128m (2011:
US$920m).
Organic revenue growth of 10%, together
with the benefit of acquisition activity,
translated into growth in total EBIT at
constant exchange rates of 19% to
US$1,175m, with a margin improvement
of 50 basis points to 26.2%.
Exceptional items - continuing operations
The gain on disposal of businesses in the
year related to a number of small disposals
of businesses, principally the disposal of an
investment classified as available for sale at
31 March 2011.
Net interest expense
In the year ended 31 March 2012, the
net interest expense was US$47m (2011:
US$71m), after crediting US$11m (2011:
US$6m) in respect of the difference between
the expected return on pension plan assets
and interest recognised on pension plan
obligations. We have continued to benefit
from the environment of low global interest
rates and our strong cash flow performance.
Tax
The effective rate of tax for the year based
on Benchmark PBT was 24.3% (2011: 21.5%).
The increase reflects a larger proportion
of Benchmark PBT from higher tax rate
jurisdictions. This rate is defined as the total
tax charge reported in the Group income
statement, adjusted for the tax impact of non-
benchmark items, divided by Benchmark
PBT.
In the year ended 31 March 2012, a one-off
tax credit of US$268m has been recognised
on the determination of certain liabilities in
respect of historic positions and the further
utilisation of tax losses. In the year ended
31 March 2011, a one-off tax credit of US$37m
was recognised in respect of the utilisation
of tax losses. These amounts have been
excluded from the calculation of the effective
rate of tax based on Benchmark PBT in view
of their size and nature.
Earnings and dividends per share
Basic earnings per share were 66.2 US cents
(2011: 57.9 US cents). Basic earnings for the
year included a loss per share of 0.6 US cents
(2011: earnings of 8.5 US cents) in respect
of discontinued operations. Benchmark
earnings per share increased to 78.9 US cents
from 66.9 US cents last year.
The second interim dividend for the year, to
be paid on 20 July 2012, is 21.75 US cents per
ordinary share (2011: 19 US cents) giving a
total dividend per share for the year of 32 US
cents (2011: 28 US cents), an increase of 14%.
The total dividend is covered 2.5 times by
Benchmark earnings per share.
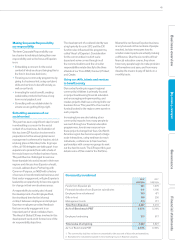
Financial review
Experian has delivered another year of strong financial performance as
our global growth programme gains pace and has reported strong revenue
growth and good profit and cash flow performance.
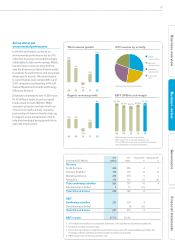
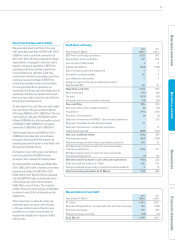
Key financials
Year ended 31 March 2012 2011
Revenue US$4,487m US$3,885m
Benchmark PBT US$1,128m US$920m
Benchmark tax rate 24.3% 21.5%
Benchmark EPS US 78.9c US 66.9c
Operating cash flow US$1,124m US$975m
Net debt US$1,818m US$1,501m
Exceptional items – continuing operations
Year ended 31 March
2012
US$m
2011
US$m
Gain/(loss) on disposal of businesses 8(21)
Interest income on legacy tax balances 4-
Gain in respect of defined benefit pension plan -29
Restructuring costs -(10)
Total exceptional items 12 (2)