Experian 2012 Annual Report Download - page 43
Download and view the complete annual report
Please find page 43 of the 2012 Experian annual report below. You can navigate through the pages in the report by either clicking on the pages listed below, or by using the keyword search tool below to find specific information within the annual report.-
 1
1 -
2
-
3
-
4
-
5
-
6
-
7
-
8
-
9
-
10
-
11
-
12
-
13
-
14
-
15
-
16
-
17
-
18
-
19
-
20
-
21
-
22
-
23
-
24
-
25
-
26
-
27
-
28
-
29
-
30
-
31
-
32
-
 33
33 -
 34
34 -
 35
35 -
 36
36 -
 37
37 -
 38
38 -
 39
39 -
 40
40 -
 41
41 -
 42
42 -
 43
43 -
 44
44 -
 45
45 -
 46
46 -
 47
47 -
 48
48 -
 49
49 -
 50
50 -
 51
51 -
 52
52 -
 53
53 -
54
-
55
-
56
-
57
-
58
-
59
-
60
-
61
-
62
-
63
-
64
-
65
-
66
-
67
-
68
-
69
-
70
-
71
-
72
-
73
-
74
-
75
-
76
-
77
-
78
-
79
-
80
-
81
-
82
-
83
-
84
-
85
-
86
-
87
-
88
-
89
-
90
-
91
-
92
-
93
-
94
-
95
-
96
-
97
-
98
-
99
-
100
-
101
-
102
-
103
-
104
-
105
-
106
-
107
-
108
-
109
-
110
-
111
-
112
-
113
-
114
-
115
-
116
-
117
-
118
-
119
-
120
-
121
-
122
-
123
-
124
-
125
-
126
-
127
-
128
-
129
-
130
-
131
-
132
-
133
-
134
-
135
-
136
-
137
-
138
-
139
-
140
-
141
-
142
-
143
-
144
-
145
-
146
-
147
-
148
-
149
-
150
-
151
-
152
-
153
-
154
-
155
-
156
-
157
-
158
-
159
-
160
-
161
-
162
-
163
-
164
 |
 |

41
GovernanceBusiness reviewBusiness overview Financial statements
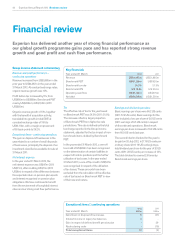
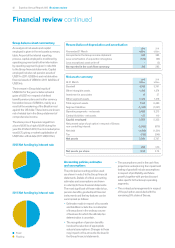
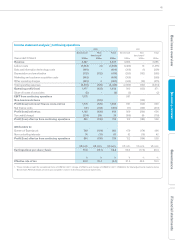
Cash flow, funding and net debt
We generated good cash flow in the year
with operating cash flow of US$1,124m (2011:
US$975m) and a cash flow conversion of
96% (2011: 98%). Working capital and capital
expenditure is managed in order to meet a
target to convert at least 90% of EBIT into
operating cash flow and this target forms
a key performance indicator. Cash flow
conversion is defined as operating cash flow
expressed as a percentage of EBIT from
continuing operations and a reconciliation
of cash generated from operations as
reported in the Group cash flow statement to
operating cash flow as reported in the cash
flow summary table is given in note 40 to the
Group financial statements.
As indicated in the cash flow summary table,
free cash flow in the year ended 31 March
2012 was US$889m (2011: US$742m). The net
cash outflow in the year of US$182m (2011:
inflow of US$458m) is after acquisition spend
of US$787m (2011: US$301m) and equity
dividends of US$290m (2011: US$251m).
Capital expenditure was US$453m (2011:
US$369m) including data and software
to support future growth. An analysis by
operating segment is given in note 9(b) to the
Group financial statements.
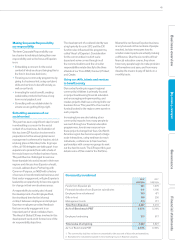
During the course of the year, new bilateral
borrowing facilities of US$617m were
arranged, with a spread of maturity dates.
At 31 March 2012, net debt was US$1,818m
(2011: US$1,501m) with undrawn committed
borrowing facilities of US$2,147m (2011:
US$1,700m). At 31 March 2012 the adjusted
net debt/EBITDA ratio, including the value
of the Serasa put option at that date of
US$1,092m, was 2.0 times. The maturity
profile of loans and borrowings and facilities
is shown in note 28 to the Group financial
statements.
There have been no defaults under any
covenants given on loans or borrowings
in the year under review or the prior year
and there is no undue concentration of
repayment obligations in respect of debt
instruments.
Cash flow summary
Year ended 31 March
2012
US$m
2011
US$m
EBIT from continuing operations 1,175 991
Depreciation and amortisation 312 283
Loss on sale of fixed assets 45
Capital expenditure (453) (369)
Sale of property, plant and equipment 37
Decrease in working capital 20 4
Loss retained in associates 33
Charge in respect of equity incentive plans within
Benchmark PBT 60 51
Operating cash flow 1,124 975
Net interest paid (57) (92)
Tax paid (107) (85)
Dividends paid to non-controlling interests (71) (56)
Free cash flow 889 742
Net cash outflow from exceptional items (5) (20)
Acquisitions (787) (301)
Purchase of investments (1) (3)
Disposal of investment in FARES – discontinued operations -279
Disposal of available for sale financial assets 12 -
Disposal of businesses – continuing operations -12
Equity dividends paid (290) (251)
Net cash (outflow)/inflow (182) 458
Net share purchases (167) (349)
New borrowings and other financing related cash flows 187 72
Net (decrease)/increase in cash and cash equivalents -
continuing operations (162) 181
Net (decrease)/increase in cash and cash equivalents -
discontinued operations (1) 52
Net (decrease)/increase in cash and cash equivalents (163) 233
Cash and cash equivalents at 1 April 408 163
Foreign exchange movements on cash and cash equivalents 912
Cash and cash equivalents at 31 March 254 408
Reconciliation of net debt
Year ended 31 March
2012
US$m
2011
US$m
At 1 April 1,501 1,627
Net cash inflow/(outflow) – as reported in the cash flow summary 182 (458)
Net share purchases 167 349
Foreign exchange and other (32) (17)
At 31 March 1,818 1,501