Experian 2012 Annual Report Download - page 106
Download and view the complete annual report
Please find page 106 of the 2012 Experian annual report below. You can navigate through the pages in the report by either clicking on the pages listed below, or by using the keyword search tool below to find specific information within the annual report.-
 1
1 -
2
-
3
-
4
-
5
-
6
-
7
-
8
-
9
-
10
-
11
-
12
-
13
-
14
-
15
-
16
-
17
-
18
-
19
-
20
-
21
-
22
-
23
-
24
-
25
-
26
-
27
-
28
-
29
-
30
-
31
-
32
-
33
-
34
-
35
-
36
-
37
-
38
-
39
-
40
-
41
-
42
-
43
-
44
-
45
-
46
-
47
-
48
-
49
-
50
-
51
-
52
-
53
-
54
-
55
-
56
-
57
-
58
-
59
-
60
-
61
-
62
-
63
-
64
-
65
-
66
-
67
-
68
-
69
-
70
-
71
-
72
-
73
-
74
-
75
-
76
-
77
-
78
-
79
-
80
-
81
-
82
-
83
-
84
-
85
-
86
-
87
-
88
-
89
-
90
-
91
-
92
-
93
-
94
-
95
-
 96
96 -
 97
97 -
 98
98 -
 99
99 -
 100
100 -
 101
101 -
 102
102 -
 103
103 -
 104
104 -
 105
105 -
 106
106 -
 107
107 -
 108
108 -
 109
109 -
 110
110 -
 111
111 -
 112
112 -
 113
113 -
 114
114 -
 115
115 -
 116
116 -
117
-
118
-
119
-
120
-
121
-
122
-
123
-
124
-
125
-
126
-
127
-
128
-
129
-
130
-
131
-
132
-
133
-
134
-
135
-
136
-
137
-
138
-
139
-
140
-
141
-
142
-
143
-
144
-
145
-
146
-
147
-
148
-
149
-
150
-
151
-
152
-
153
-
154
-
155
-
156
-
157
-
158
-
159
-
160
-
161
-
162
-
163
-
164
 |
 |

104 Experian Annual Report 2012 Financial statements
Notes to the Group financial statements continued
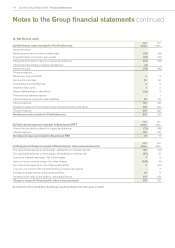
8. Financial risk management (continued)
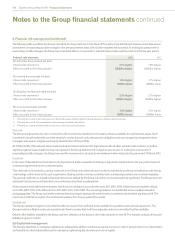
The following table quantifies the Group’s sensitivity to interest rate risk on the basis of the profile of net debt at each balance sheet date and an
assessment of reasonably possible changes in the principal interest rates, with all other variables held constant. In making its assessment of
reasonably possible changes, the Group has considered data on movements in relevant interest rates over the most recent three-year period.
Interest rate exposure 2012 2011
On US dollar denominated net debt:
Interest rate movement 0.7% higher 1.6% higher
Effect on profit for the financial year1US$14m higher US$16m higher
On sterling denominated net debt:
Interest rate movement 1.4% higher 1.7% higher
Effect on profit for the financial year2US$1m lower US$9m lower
On Brazilian real denominated net debt:
Interest rate movement 2.3% higher 2.3% higher
Effect on profit for the financial year3US$3m higher US$2m higher
On euro denominated net debt:
Interest rate movement 1.4% higher 1.5% higher
Effect on profit for the financial year2US$7m lower US$8m lower
1. Primarily as a result of fair value gains on interest rate swaps offset by higher interest expense on floating rate borrowings.
2. Primarily as a result of the revaluation of borrowings and related derivatives.
3. Primarily as a result of higher interest income on cash and cash equivalents.
Price risk
The Group is exposed to price risk in connection with investments classified on the balance sheet as available for sale financial assets. Such
investments are primarily held to provide security in connection with unfunded pension obligations and are managed by independent fund
managers who seek to mitigate such risk by diversification of the portfolio.
At 31 March 2012, if the relevant stock market and other indices had been 10% higher/lower with all other variables held constant, no further
significant gains/losses would have been recognised in the Group statement of comprehensive income. In making its assessment of
reasonably possible changes, the Group has used the movements in relevant stock market and other indices for the year ended 31 March 2012.
Credit risk
In the case of derivative financial instruments, deposits and trade receivables, the Group is exposed to credit risk from the non-performance of
contractual agreements by the contracted party.
This credit risk is minimised by a policy under which the Group only enters into such contracts with banks and financial institutions with strong
credit ratings, within limits set for each organisation. Dealing activity is closely controlled and counterparty positions are monitored regularly.
The general credit risk on derivative financial instruments utilised by the Group is therefore not considered to be significant. The Group does not
anticipate that any losses will arise from non-performance by these counterparties.
At the balance sheet date trade receivables with financial institutions accounted for some 25% (2011: 26%) of total trade receivables in Brazil,
some 28% (2011: 23%) in the UK and some 27% (2011: 22%) in the USA. The remaining balances are distributed across multiple industries
and geographies. The Group has implemented policies that require appropriate credit checks on potential clients before granting credit. The
maximum credit risk in respect of such financial assets is the carrying value of the assets.
Liquidity risk
The Group maintains long-term committed facilities to ensure it has sufficient funds available for operations and planned expansions. The
Group monitors rolling forecasts of projected cash flows to ensure that it will have adequate undrawn committed facilities available.
Details of the facilities available to the Group and their utilisation at the balance sheet date are given in note 28. The maturity analysis of financial
liabilities is given in note 32.
(b) Capital risk management
The Group’s objectives in managing capital are to safeguard its ability to continue as a going concern in order to provide returns for shareholders
and benefits for other stakeholders and to maintain an optimal capital structure and cost of capital.