Experian 2012 Annual Report Download - page 133
Download and view the complete annual report
Please find page 133 of the 2012 Experian annual report below. You can navigate through the pages in the report by either clicking on the pages listed below, or by using the keyword search tool below to find specific information within the annual report.-
 1
1 -
2
-
3
-
4
-
5
-
6
-
7
-
8
-
9
-
10
-
11
-
12
-
13
-
14
-
15
-
16
-
17
-
18
-
19
-
20
-
21
-
22
-
23
-
24
-
25
-
26
-
27
-
28
-
29
-
30
-
31
-
32
-
33
-
34
-
35
-
36
-
37
-
38
-
39
-
40
-
41
-
42
-
43
-
44
-
45
-
46
-
47
-
48
-
49
-
50
-
51
-
52
-
53
-
54
-
55
-
56
-
57
-
58
-
59
-
60
-
61
-
62
-
63
-
64
-
65
-
66
-
67
-
68
-
69
-
70
-
71
-
72
-
73
-
74
-
75
-
76
-
77
-
78
-
79
-
80
-
81
-
82
-
83
-
84
-
85
-
86
-
87
-
88
-
89
-
90
-
91
-
92
-
93
-
94
-
95
-
96
-
97
-
98
-
99
-
100
-
101
-
102
-
103
-
104
-
105
-
106
-
107
-
108
-
109
-
110
-
111
-
112
-
113
-
114
-
115
-
116
-
117
-
118
-
119
-
120
-
121
-
122
-
 123
123 -
 124
124 -
 125
125 -
 126
126 -
 127
127 -
 128
128 -
 129
129 -
 130
130 -
 131
131 -
 132
132 -
 133
133 -
 134
134 -
 135
135 -
 136
136 -
 137
137 -
 138
138 -
 139
139 -
 140
140 -
 141
141 -
 142
142 -
 143
143 -
144
-
145
-
146
-
147
-
148
-
149
-
150
-
151
-
152
-
153
-
154
-
155
-
156
-
157
-
158
-
159
-
160
-
161
-
162
-
163
-
164
 |
 |
131
Governance Financial statementsBusiness reviewBusiness overview
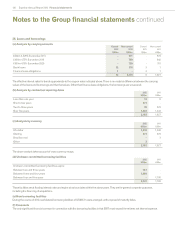
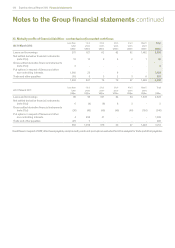
33. Share-based payments
The Group has a number of equity settled, share-based employee incentive plans. Details of the arrangements under which options are granted
and awards made are given below, together with information on their valuation and cost. The price of the Company’s ordinary shares is quoted
in sterling and accordingly option, award and share prices are disclosed in sterling.
(a) Share options
(i) Summary of arrangements and valuations
Options have only been granted in the current and prior year in respect of Experian Sharesave Plans and the amounts involved are not
significant. Accordingly disclosures relating to the application of valuation techniques, inputs into valuation models and fair values of options
granted have been omitted. Information in respect of options granted in prior years has been previously provided in the relevant annual reports.
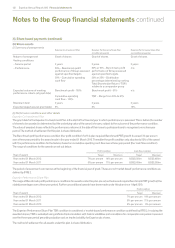
There were no grants of options under the Experian Share Option Plan in the year ended 31 March 2012 and the year ended 31 March 2011 but
options remain outstanding under this plan. Fully vested options also exist under The GUS plc North America Executive Stock Option Plan, a
former GUS share option plan, and these options had a maximum term of six years from the date of grant.
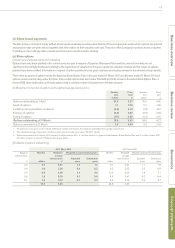
(ii) Movement in number of options and weighted average exercise price
Number
2012
million
Price
2012
£
Number
2011
million
Price
2011
£
Options outstanding at 1 April 24.8 4.27 35.3 4.42
Grant of options 1.1 6.16 0.7 4.85
Forfeiture and cancellation of options1(0.9) 4.74 (1.8) 4.01
Exercise of options2(9.9) 3.87 (8.9) 4.94
Expiry of options (0.1) 4.85 (0.5) 4.91
Options outstanding at 31 March 15.0 4.63 24.8 4.27
Options exercisable at 31 March 3.8 4.54 5.9 5.16
1. For plans of a ‘save as you earn’ nature, forfeitures include non-leavers who have not completed the savings requirement.
2. The weighted average share price of options exercised during the year was £7.84 (2011: £6.90).
3. Options exercisable at 31 March 2012 include 0.1 million shares (2011: 0.1 million shares) in respect of the Experian Share Option Plan and 3.7 million shares (2011:
5.8 million shares) in respect of Experian Sharesave Plans.
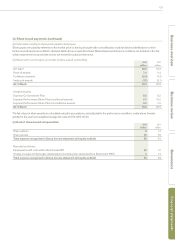
(iii) Details of options outstanding
At 31 March 2012 At 31 March 2011
Range of
exercise prices
£
Number
million
Weighted
average
exercise price
£
Weighted average remaining lives Number
million
Weighted
average
exercise price
£
Weighted average remaining lives
Expected
years
Contractual
years
Expected
years
Contractual
years
2-3 0.7 2.91 1.3 1.7 2.1 2.91 1.1 1.5
3-4 1.6 3.36 0.4 6.3 6.5 3.23 1.2 6.9
4-5 9.8 4.66 1.1 9.1 12.0 4.65 1.9 7.1
5-6 1.9 5.39 0.1 6.6 4.0 5.41 0.2 4.4
6-7 1.0 6.18 2.7 3.3 0.2 6.13 0.3 6.1
15.0 4.63 24.8 4.27