Experian 2012 Annual Report Download - page 122
Download and view the complete annual report
Please find page 122 of the 2012 Experian annual report below. You can navigate through the pages in the report by either clicking on the pages listed below, or by using the keyword search tool below to find specific information within the annual report.-
 1
1 -
2
-
3
-
4
-
5
-
6
-
7
-
8
-
9
-
10
-
11
-
12
-
13
-
14
-
15
-
16
-
17
-
18
-
19
-
20
-
21
-
22
-
23
-
24
-
25
-
26
-
27
-
28
-
29
-
30
-
31
-
32
-
33
-
34
-
35
-
36
-
37
-
38
-
39
-
40
-
41
-
42
-
43
-
44
-
45
-
46
-
47
-
48
-
49
-
50
-
51
-
52
-
53
-
54
-
55
-
56
-
57
-
58
-
59
-
60
-
61
-
62
-
63
-
64
-
65
-
66
-
67
-
68
-
69
-
70
-
71
-
72
-
73
-
74
-
75
-
76
-
77
-
78
-
79
-
80
-
81
-
82
-
83
-
84
-
85
-
86
-
87
-
88
-
89
-
90
-
91
-
92
-
93
-
94
-
95
-
96
-
97
-
98
-
99
-
100
-
101
-
102
-
103
-
104
-
105
-
106
-
107
-
108
-
109
-
110
-
111
-
 112
112 -
 113
113 -
 114
114 -
 115
115 -
 116
116 -
 117
117 -
 118
118 -
 119
119 -
 120
120 -
 121
121 -
 122
122 -
 123
123 -
 124
124 -
 125
125 -
 126
126 -
 127
127 -
 128
128 -
 129
129 -
 130
130 -
 131
131 -
 132
132 -
133
-
134
-
135
-
136
-
137
-
138
-
139
-
140
-
141
-
142
-
143
-
144
-
145
-
146
-
147
-
148
-
149
-
150
-
151
-
152
-
153
-
154
-
155
-
156
-
157
-
158
-
159
-
160
-
161
-
162
-
163
-
164
 |
 |
120 Experian Annual Report 2012 Financial statements
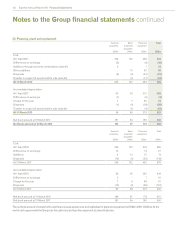
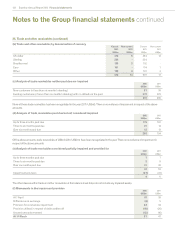
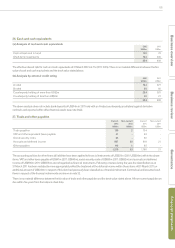
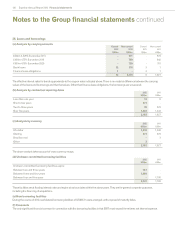
Notes to the Group financial statements continued
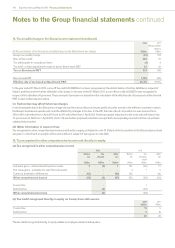
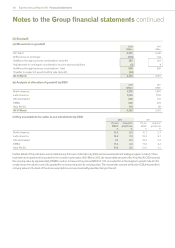
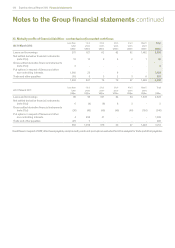
20. Goodwill
(a) Movements in goodwill
2012
US$m
2011
US$m
At 1 April 3,761 3,412
Differences on exchange (115) 144
Additions through business combinations (note 41) 553 201
Adjustments to contingent consideration on prior year acquisitions (3) 4
Additions through business combinations - total 550 205
Transfer in respect of assets held for sale (note 42) (33) -
At 31 March 4,163 3,761
(b) Analysis of allocation of goodwill by CGU
2012
US$m
2011
US$m
North America 1,778 1,675
Latin America 1,322 1,116
UK and Ireland 686 611
EMEA 262 270
Asia Pacific 115 89
At 31 March 4,163 3,761
(c) Key assumptions for value-in-use calculations by CGU
2012 2011
Pre-tax
WACC
%
Long-term
growth rate
%
Pre-tax
WACC
%
Long-term
growth rate
%
North America 11.3 2.3 12.7 2.3
Latin America 14.8 7.0 16.4 6.7
UK and Ireland 9.1 2.3 10.4 2.3
EMEA 11.4 4.3 11. 2 4.3
Asia Pacific 11.6 5.3 12.0 5.1
Further details of the principles used in determining the basis of allocation by CGU and annual impairment testing are given in note 6. There
have been no impairments of goodwill in the current or prior years. At 31 March 2012, the recoverable amount of the Asia Pacific CGU exceeds
the carrying value by approximately US$80m and an increase in the pre-tax WACC of 1.3% or a reduction in the long-term growth rate of 1.9%
would reduce the value-in-use of its goodwill to an amount equal to its carrying value. The recoverable amount of the other CGUs exceed their
carrying value on the basis of the above assumptions and any reasonably possible changes thereof.