Experian 2012 Annual Report Download - page 2
Download and view the complete annual report
Please find page 2 of the 2012 Experian annual report below. You can navigate through the pages in the report by either clicking on the pages listed below, or by using the keyword search tool below to find specific information within the annual report.-
 1
1 -
 2
2 -
 3
3 -
 4
4 -
 5
5 -
 6
6 -
 7
7 -
 8
8 -
 9
9 -
 10
10 -
 11
11 -
 12
12 -
 13
13 -
14
-
15
-
16
-
17
-
18
-
19
-
20
-
21
-
22
-
23
-
24
-
25
-
26
-
27
-
28
-
29
-
30
-
31
-
32
-
33
-
34
-
35
-
36
-
37
-
38
-
39
-
40
-
41
-
42
-
43
-
44
-
45
-
46
-
47
-
48
-
49
-
50
-
51
-
52
-
53
-
54
-
55
-
56
-
57
-
58
-
59
-
60
-
61
-
62
-
63
-
64
-
65
-
66
-
67
-
68
-
69
-
70
-
71
-
72
-
73
-
74
-
75
-
76
-
77
-
78
-
79
-
80
-
81
-
82
-
83
-
84
-
85
-
86
-
87
-
88
-
89
-
90
-
91
-
92
-
93
-
94
-
95
-
96
-
97
-
98
-
99
-
100
-
101
-
102
-
103
-
104
-
105
-
106
-
107
-
108
-
109
-
110
-
111
-
112
-
113
-
114
-
115
-
116
-
117
-
118
-
119
-
120
-
121
-
122
-
123
-
124
-
125
-
126
-
127
-
128
-
129
-
130
-
131
-
132
-
133
-
134
-
135
-
136
-
137
-
138
-
139
-
140
-
141
-
142
-
143
-
144
-
145
-
146
-
147
-
148
-
149
-
150
-
151
-
152
-
153
-
154
-
155
-
156
-
157
-
158
-
159
-
160
-
161
-
162
-
163
-
164
 |
 |

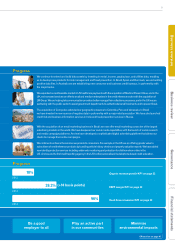
Experian Annual Report 2012
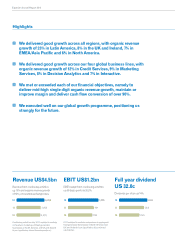
Revenue US$4.5bn
Revenue from continuing activities
up 15% and organic revenue growth
of 10%, at constant exchange rates.
Continuing activities only. 2011 restated to exclude
comparison shopping and lead generation
businesses in North America and UK and Ireland
(now classified as discontinued operations).
Full year dividend
US 32.0c
Dividends per share up 14%.
EBIT US$1.2bn
EBIT margin from continuing activities
up 50 basis points to 26.2%.
2011 restated to exclude comparison shopping and
lead generation businesses in North America and
UK and Ireland (now classified as discontinued
operations).
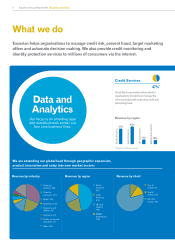
We delivered good growth across all regions, with organic revenue
growth of 23% in Latin America, 8% in the UK and Ireland, 7% in
EMEA/Asia Pacific and 6% in North America.
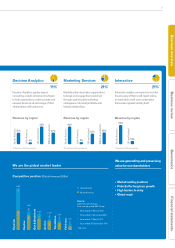
We delivered good growth across our four global business lines, with
organic revenue growth of 12% in Credit Services, 9% in Marketing
Services, 8% in Decision Analytics and 7% in Interactive.
We met or exceeded each of our financial objectives, namely to
deliver mid-high single digit organic revenue growth, maintain or
improve margin and deliver cash flow conversion of over 90%.
We executed well on our global growth programme, positioning us
strongly for the future.
12
11
10
4,485
3,859
3,803
12
11
10
1,175
991
935
12
11
10
32.0
28.0
23.0
Highlights