Experian 2012 Annual Report Download - page 104
Download and view the complete annual report
Please find page 104 of the 2012 Experian annual report below. You can navigate through the pages in the report by either clicking on the pages listed below, or by using the keyword search tool below to find specific information within the annual report.-
 1
1 -
2
-
3
-
4
-
5
-
6
-
7
-
8
-
9
-
10
-
11
-
12
-
13
-
14
-
15
-
16
-
17
-
18
-
19
-
20
-
21
-
22
-
23
-
24
-
25
-
26
-
27
-
28
-
29
-
30
-
31
-
32
-
33
-
34
-
35
-
36
-
37
-
38
-
39
-
40
-
41
-
42
-
43
-
44
-
45
-
46
-
47
-
48
-
49
-
50
-
51
-
52
-
53
-
54
-
55
-
56
-
57
-
58
-
59
-
60
-
61
-
62
-
63
-
64
-
65
-
66
-
67
-
68
-
69
-
70
-
71
-
72
-
73
-
74
-
75
-
76
-
77
-
78
-
79
-
80
-
81
-
82
-
83
-
84
-
85
-
86
-
87
-
88
-
89
-
90
-
91
-
92
-
93
-
 94
94 -
 95
95 -
 96
96 -
 97
97 -
 98
98 -
 99
99 -
 100
100 -
 101
101 -
 102
102 -
 103
103 -
 104
104 -
 105
105 -
 106
106 -
 107
107 -
 108
108 -
 109
109 -
 110
110 -
 111
111 -
 112
112 -
 113
113 -
 114
114 -
115
-
116
-
117
-
118
-
119
-
120
-
121
-
122
-
123
-
124
-
125
-
126
-
127
-
128
-
129
-
130
-
131
-
132
-
133
-
134
-
135
-
136
-
137
-
138
-
139
-
140
-
141
-
142
-
143
-
144
-
145
-
146
-
147
-
148
-
149
-
150
-
151
-
152
-
153
-
154
-
155
-
156
-
157
-
158
-
159
-
160
-
161
-
162
-
163
-
164
 |
 |

102 Experian Annual Report 2012 Financial statements
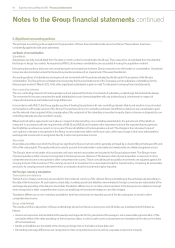
Notes to the Group financial statements continued
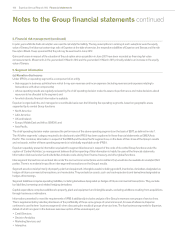
6. Critical accounting estimates and judgments (continued)
The most significant of these judgments is in respect of intangible assets where certain costs incurred in the developmental phase of an
internal project are capitalised if a number of criteria are met. Management has made certain judgments and assumptions when assessing
whether a project meets these criteria, and on measuring the costs and the economic life attributed to such projects. On acquisition, specific
intangible assets are identified and recognised separately from goodwill and then amortised over their estimated useful lives. These include
such items as brand names and customer lists, to which value is first attributed at the time of acquisition. The capitalisation of these assets and
the related amortisation charges are based on judgments about the value and economic life of such items. The economic lives for intangible
assets are estimated at between three and ten years for internal projects, which include databases, internal use software and internally
generated software, and between two and twenty years for acquisition intangibles. Further details of the amounts of, and movements in, such
assets are given in note 21.
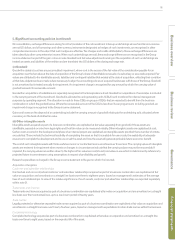
7. Use of non-GAAP measures in the Group financial statements
The Group has identified certain measures that it believes will assist understanding of the performance of the business. The measures are not
defined under IFRS and they may not be directly comparable with other companies’ adjusted measures. The non-GAAP measures are not
intended to be a substitute for, or superior to, any IFRS measures of performance but management has included them as they consider them to
be important comparables and key measures used within the business for assessing performance.
The following are the key non-GAAP measures identified by the Group and used in the Group financial statements:
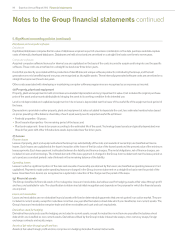
Benchmark profit before tax (‘Benchmark PBT’)
Benchmark PBT is defined as profit before amortisation of acquisition intangibles, acquisition expenses, goodwill impairments, adjustments
to contingent consideration, charges in respect of the demerger-related equity incentive plans, exceptional items, financing fair value
remeasurements, tax and discontinued operations. It includes the Group’s share of continuing associates’ pre-tax results.
Earnings before interest and tax (‘EBIT’)
EBIT is defined as profit before amortisation of acquisition intangibles, acquisition expenses, goodwill impairments, adjustments to contingent
consideration, charges in respect of the demerger-related equity incentive plans, exceptional items, net finance costs, tax and discontinued
operations. It includes the Group’s share of continuing associates’ pre-tax results.
Benchmark earnings
Benchmark earnings represents Benchmark PBT less attributable tax and non-controlling interests. Benchmark earnings attributable to non-
controlling interests represents that portion of Benchmark earnings that relate to non-controlling interests. Benchmark PBT less attributable tax
is designated as overall benchmark earnings. The attributable tax for the purposes of determining benchmark earnings excludes significant tax
credits and charges arising in the year which, in view of their size or nature, are not comparable with previous periods together with tax arising
on exceptional items and on total adjustments made to derive Benchmark PBT.
Benchmark earnings per share (‘Benchmark EPS’)
Benchmark EPS represents Benchmark earnings divided by a weighted average number of shares, and is disclosed to indicate the underlying
profitability of the Group.
Exceptional items
The separate reporting of non-recurring exceptional items gives an indication of the Group’s underlying performance. Exceptional items
are those arising from the profit or loss on disposal of businesses, closure costs of major business units or costs of significant restructuring
programmes. All other restructuring costs are charged against EBIT in the segments in which they are incurred.
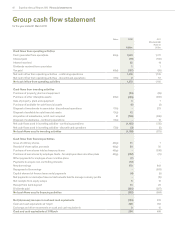
Operating cash flow
Operating cash flow is calculated as cash generated from operations adjusted for outflows in respect of acquisition expenses, the purchase and
disposal of property, plant and equipment and other intangible assets, and adding dividends from continuing associates but excluding any cash
inflows and outflows in respect of exceptional items. It is reconciled to cash generated from operations in note 40(h).
Operating cash flow is defined as EBIT from continuing operations, plus depreciation, amortisation and charges in respect of equity incentive
plans within Benchmark PBT, less capital expenditure net of disposal proceeds and further adjusted for changes in working capital and profit or
loss retained in continuing associates.
Net debt
Net debt is calculated as total debt less cash and cash equivalents and other highly liquid bank deposits with original maturities greater than
three months. Total debt includes loans and borrowings (and the fair value of derivatives hedging loans and borrowings), overdrafts and
obligations under finance leases. Accrued interest is excluded from net debt.