Big Lots 2015 Annual Report Download - page 96
Download and view the complete annual report
Please find page 96 of the 2015 Big Lots annual report below. You can navigate through the pages in the report by either clicking on the pages listed below, or by using the keyword search tool below to find specific information within the annual report.-
 1
1 -
2
-
3
-
4
-
5
-
6
-
7
-
8
-
9
-
10
-
11
-
12
-
13
-
14
-
15
-
16
-
17
-
18
-
19
-
20
-
21
-
22
-
23
-
24
-
25
-
26
-
27
-
28
-
29
-
30
-
31
-
32
-
33
-
34
-
35
-
36
-
37
-
38
-
39
-
40
-
41
-
42
-
43
-
44
-
45
-
46
-
47
-
48
-
49
-
50
-
51
-
52
-
53
-
54
-
55
-
56
-
57
-
58
-
59
-
60
-
61
-
62
-
63
-
64
-
65
-
66
-
67
-
68
-
69
-
70
-
71
-
72
-
73
-
74
-
75
-
76
-
77
-
78
-
79
-
80
-
81
-
82
-
83
-
84
-
85
-
 86
86 -
 87
87 -
 88
88 -
 89
89 -
 90
90 -
 91
91 -
 92
92 -
 93
93 -
 94
94 -
 95
95 -
 96
96 -
 97
97 -
 98
98 -
 99
99 -
 100
100 -
 101
101 -
 102
102 -
 103
103 -
 104
104 -
 105
105 -
 106
106 -
107
-
108
-
109
-
110
-
111
-
112
-
113
-
114
-
115
-
116
-
117
-
118
-
119
-
120
-
121
-
122
-
123
-
124
-
125
-
126
-
127
-
128
-
129
-
130
-
131
-
132
-
133
-
134
-
135
-
136
-
137
-
138
-
139
-
140
-
141
-
142
-
143
-
144
-
145
-
146
-
147
-
148
-
149
-
150
-
151
-
152
-
153
-
154
-
155
-
156
-
157
-
158
-
159
-
160
-
161
-
162
-
163
-
164
-
165
-
166
 |
 |

19
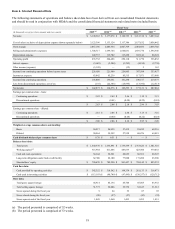
(c) During 2015, we adopted Accounting Standards Update 2015-17 related to the presentation of deferred taxes. As such, we
reclassified our current deferred tax assets and liabilities to noncurrent deferred income tax assets for all fiscal years
presented.
Item 7. Management’s Discussion and Analysis of Financial Condition and Results of Operations
Overview
The discussion and analysis presented below should be read in conjunction with the accompanying consolidated financial
statements and related notes. Please refer to “Item 1A. Risk Factors” of this Form 10-K for a discussion of forward-looking
statements and certain risk factors that may have a material adverse effect on our business, financial condition, results of
operations, and/or liquidity.
Our fiscal year ends on the Saturday nearest to January 31, which results in some fiscal years with 52 weeks and some with 53
weeks. Fiscal years 2015, 2014, and 2013 were each comprised of 52 weeks. Fiscal year 2016 will be comprised of 52 weeks.
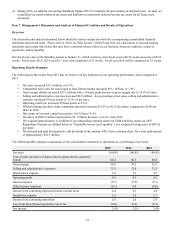
Operating Results Summary
The following are the results from 2015 that we believe are key indicators of our operating performance when compared to
2014.
• Net sales increased $13.5 million, or 0.3%.
• Comparable store sales for stores open at least fifteen months increased $91.1 million, or 1.8%.
• Gross margin dollars increased $23.2 million with a 30 basis point increase in gross margin rate to 39.8% of sales.
• Selling and administrative expenses increased $8.9 million. As a percentage of net sales, selling and administrative
expenses increased 10 basis points to 32.9% of net sales.
• Operating profit rate increased 20 basis points to 4.5%.
• Diluted earnings per share from continuing operations increased 14.2% to $2.81 per share, compared to $2.46 per
share in 2014.
• Our return on invested capital increased to 16.6% from 14.9%.
• Inventory of $850.0 million represented a $1.7 million decrease, or 0.2%, from 2014.
• We acquired approximately 4.4 million of our outstanding common shares for $200.0 million, under our 2015
Repurchase Program (as defined below in “Capital Resources and Liquidity”), at a weighted average price of $45.82
per share.
• We declared and paid four quarterly cash dividends in the amount of $0.19 per common share, for a total paid amount
of approximately $38.5 million.
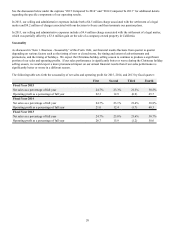
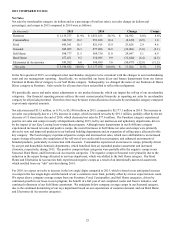
The following table compares components of our consolidated statements of operations as a percentage of net sales:
2015 2014 2013
Net sales 100.0% 100.0% 100.0%
Cost of sales (exclusive of depreciation expense shown separately
below) 60.2 60.5 60.8
Gross margin 39.8 39.5 39.2
Selling and administrative expenses 32.9 32.8 32.5
Depreciation expense 2.4 2.3 2.2
Operating profit 4.5 4.3 4.5
Interest expense (0.1)(0.0)(0.1)
Other income (expense) (0.1) 0.0 (0.0)
Income from continuing operations before income taxes 4.4 4.3 4.4
Income tax expense 1.6 1.6 1.7
Income from continuing operations 2.8 2.6 2.8
Loss from discontinued operations, net of tax (0.0)(0.4)(0.3)
Net income 2.8% 2.2% 2.4%