Big Lots 2015 Annual Report Download - page 105
Download and view the complete annual report
Please find page 105 of the 2015 Big Lots annual report below. You can navigate through the pages in the report by either clicking on the pages listed below, or by using the keyword search tool below to find specific information within the annual report.-
 1
1 -
2
-
3
-
4
-
5
-
6
-
7
-
8
-
9
-
10
-
11
-
12
-
13
-
14
-
15
-
16
-
17
-
18
-
19
-
20
-
21
-
22
-
23
-
24
-
25
-
26
-
27
-
28
-
29
-
30
-
31
-
32
-
33
-
34
-
35
-
36
-
37
-
38
-
39
-
40
-
41
-
42
-
43
-
44
-
45
-
46
-
47
-
48
-
49
-
50
-
51
-
52
-
53
-
54
-
55
-
56
-
57
-
58
-
59
-
60
-
61
-
62
-
63
-
64
-
65
-
66
-
67
-
68
-
69
-
70
-
71
-
72
-
73
-
74
-
75
-
76
-
77
-
78
-
79
-
80
-
81
-
82
-
83
-
84
-
85
-
86
-
87
-
88
-
89
-
90
-
91
-
92
-
93
-
94
-
 95
95 -
 96
96 -
 97
97 -
 98
98 -
 99
99 -
 100
100 -
 101
101 -
 102
102 -
 103
103 -
 104
104 -
 105
105 -
 106
106 -
 107
107 -
 108
108 -
 109
109 -
 110
110 -
 111
111 -
 112
112 -
 113
113 -
 114
114 -
 115
115 -
116
-
117
-
118
-
119
-
120
-
121
-
122
-
123
-
124
-
125
-
126
-
127
-
128
-
129
-
130
-
131
-
132
-
133
-
134
-
135
-
136
-
137
-
138
-
139
-
140
-
141
-
142
-
143
-
144
-
145
-
146
-
147
-
148
-
149
-
150
-
151
-
152
-
153
-
154
-
155
-
156
-
157
-
158
-
159
-
160
-
161
-
162
-
163
-
164
-
165
-
166
 |
 |

28
2014 COMPARED TO 2013
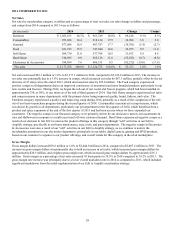
Net Sales
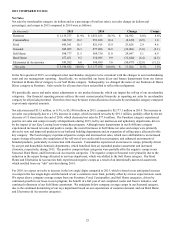
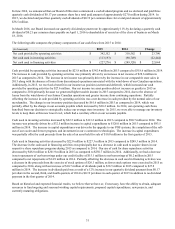
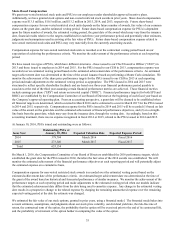
Net sales by merchandise category, in dollars and as a percentage of total net sales, net sales change in dollars and percentage,
and comps from 2014 compared to 2013 were as follows:
(In thousands) 2014 2013 Change Comps
Furniture $ 1,051,165 20.3% $ 961,749 18.8% $ 89,416 9.3% 8.3%
Consumables 953,028 18.4 918,124 17.9 34,904 3.8 5.0
Seasonal 877,086 16.9 907,787 17.7 (30,701)(3.4)(2.7)
Food 821,915 15.9 747,840 14.6 74,075 9.9 11.0
Soft Home 569,730 11.0 537,798 10.5 31,932 5.9 8.6
Hard Home 510,095 9.9 565,126 11.0 (55,031)(9.7)(8.8)
Electronics & Accessories 394,059 7.6 486,331 9.5 (92,272)(19.0)(17.8)
Net sales $ 5,177,078 100.0% $ 5,124,755 100.0% $ 52,323 1.0% 1.8%
Net sales increased $52.3 million or 1.0% to $5,177.1 million in 2014, compared to $5,124.8 million in 2013. The increase in
net sales was principally due to a 1.8% increase in comps, which increased net sales by $87.3 million, partially offset by the net
decrease of 33 stores since the end of 2013, which decreased net sales by $35.0 million. The Food category experienced
positive comps in all departments due to an improved consistency of assortment and more branded products, particularly in our
new coolers and freezers. During 2014, we began the roll-out of our cooler and freezer program, which had been installed in
approximately 750, or 50%, of our stores as of the end of third quarter of 2014. Our Soft Home category experienced net sales
and comp increases in many departments, with the primary driver being improved quality, brand, fashion, and value. The
Furniture category experienced a positive and improving comp during 2014, primarily as a result of the completion of the roll-
out of our lease-to-purchase program during the second quarter of 2014. Consumables experienced a comp increase, which
was driven by growth in all departments, particularly our pet department in the first quarter of 2014, which benefited from a
product and space expansion at the end of the first quarter of 2013 and has been an area where we have expanded our
assortment. The negative comps in our Seasonal category were primarily driven by our decision to narrow our assortments in
toys and Halloween in response to a multi-year trend of lower customer demand. Hard Home experienced negative comps as a
result of our decision in late 2013 to narrow the product offerings in this category through “edit” activities in our Edit to
Amplify strategy, specifically in our home maintenance, auto, tools, and paint departments. The negative comps in Electronics
& Accessories were also a result of our “edit” activities in our Edit to Amplify strategy, as we continue to narrow the
merchandise assortment in our electronics department, particularly in our tablet, digital camera, gaming and DVD products,
based on our customer’s response to our product offerings, and overall trends for this category in the retail marketplace.
Gross Margin
Gross margin dollars increased $36.6 million or 1.8% to $2,044.0 million in 2014, compared to $2,007.4 million in 2013. The
increase in gross margin dollars was principally due to both an increase in net sales, which increased gross margin dollars by
approximately $20.5 million, and a higher gross margin rate, which increased gross margin dollars by approximately $16.1
million. Gross margin as a percentage of net sales increased 30 basis points to 39.5% in 2014 compared to 39.2% in 2013. The
gross margin rate increase was principally due to a lower overall markdown rate in 2014 as compared to 2013, which included
significant markdowns from the initial implementation of our Edit to Amplify merchandise strategy.