Big Lots 2015 Annual Report Download - page 33
Download and view the complete annual report
Please find page 33 of the 2015 Big Lots annual report below. You can navigate through the pages in the report by either clicking on the pages listed below, or by using the keyword search tool below to find specific information within the annual report.-
 1
1 -
2
-
3
-
4
-
5
-
6
-
7
-
8
-
9
-
10
-
11
-
12
-
13
-
14
-
15
-
16
-
17
-
18
-
19
-
20
-
21
-
22
-
 23
23 -
 24
24 -
 25
25 -
 26
26 -
 27
27 -
 28
28 -
 29
29 -
 30
30 -
 31
31 -
 32
32 -
 33
33 -
 34
34 -
 35
35 -
 36
36 -
 37
37 -
 38
38 -
 39
39 -
 40
40 -
 41
41 -
 42
42 -
 43
43 -
44
-
45
-
46
-
47
-
48
-
49
-
50
-
51
-
52
-
53
-
54
-
55
-
56
-
57
-
58
-
59
-
60
-
61
-
62
-
63
-
64
-
65
-
66
-
67
-
68
-
69
-
70
-
71
-
72
-
73
-
74
-
75
-
76
-
77
-
78
-
79
-
80
-
81
-
82
-
83
-
84
-
85
-
86
-
87
-
88
-
89
-
90
-
91
-
92
-
93
-
94
-
95
-
96
-
97
-
98
-
99
-
100
-
101
-
102
-
103
-
104
-
105
-
106
-
107
-
108
-
109
-
110
-
111
-
112
-
113
-
114
-
115
-
116
-
117
-
118
-
119
-
120
-
121
-
122
-
123
-
124
-
125
-
126
-
127
-
128
-
129
-
130
-
131
-
132
-
133
-
134
-
135
-
136
-
137
-
138
-
139
-
140
-
141
-
142
-
143
-
144
-
145
-
146
-
147
-
148
-
149
-
150
-
151
-
152
-
153
-
154
-
155
-
156
-
157
-
158
-
159
-
160
-
161
-
162
-
163
-
164
-
165
-
166
 |
 |

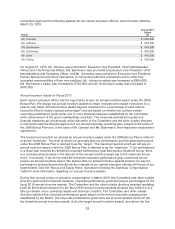
• an increase of $13.5 million in net sales;
• Adjusted income from continuing operations of $2.971in diluted earnings per share, compared
to income from continuing operations of $2.46 in diluted earnings per share in fiscal 2014, a
21% increase;
• an increase of 30 basis points in gross margin rate;
• return on invested capital (i.e., net operating profit after-tax divided by invested capital)
(“ROIC”) of 16.6%;
• an increase in operating profit of $11.2 million, or 5%; and
• $200 million returned to shareholders through share repurchases and approximately $39
million returned to shareholders through dividends.
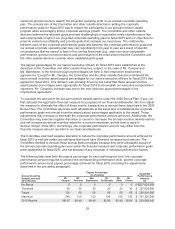
Named Executive Officer Compensation for Fiscal 2015
The principal elements of our executive compensation program – salary, annual cash incentive awards
and equity awards – remained the same in fiscal 2015. The Committee and our other outside directors
are committed to a pay-for-performance philosophy focused on the continued improvement of our
financial and operating performance and believe that emphasizing at-risk and variable compensation
advances the objectives of our executive compensation program. Accordingly, the Committee and our
other outside directors structured a significant portion of the compensation awarded to our named
executive officers for fiscal 2015 as “at risk” or “variable” and dependent on our performance and/or the
value of our common shares, including:
•Annual Cash Incentive Awards. Each named executive officer was eligible to receive a cash
performance bonus based solely on our operating profit. The fiscal 2015 annual incentive
awards were structured so that the target bonus would be earned only if we achieved the
operating profit for fiscal 2015 projected in our annual corporate operating plan. The
Committee and our other outside directors selected operating profit as the sole financial
measure because they believe it focuses our named executive officers on increasing our
revenues and controlling our costs. Based on our $235,731,648 operating profit in fiscal 2015,
as adjusted and described below in the “Elements of our Executive Compensation for Fiscal
2015 – Annual Incentive Award for Fiscal 2015” section of the CD&A, our named executive
officers earned an annual incentive award for fiscal 2015 equal to 166% of their respective
target bonus.
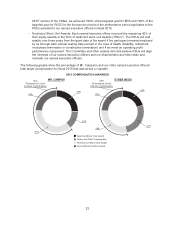
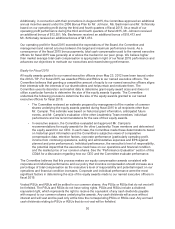
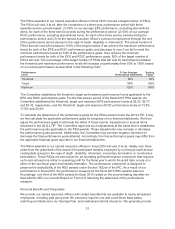
•Performance Share Unit Awards. Each named executive officer received 60% of their equity
awards in the form of performance share unit awards (“PSUs”). The PSUs awarded to our
named executive officers in fiscal 2015 will vest, if at all, after the completion of a three-year
performance period based: (1) 50% on our average EPS performance, excluding plan-defined
items, for each of the three fiscal year service periods during the performance period; (2) 50%
on our average ROIC performance, excluding plan-defined items, for each of the three fiscal
year service periods during the performance period; and (3) on the named executive officer’s
continued employment through the end of the performance period (except in the case of
death, disability or retirement). The Committee and our other outside directors selected EPS
and ROIC as the financial measures applicable to the PSUs to incentivize our named
executive officers to achieve long-term financial results that they believe will create
shareholder value. Based on EPS of $2.81 and ROIC of 16.6%, as adjusted and described
below in the “Elements of our Executive Compensation for Fiscal 2015 – Equity for Fiscal
1Adjusted to exclude an after-tax impact of $0.11 associated with pension termination costs and
$0.05 for a loss contingency associated with a merchandise related legal matter.
21