Big Lots 2015 Annual Report Download - page 150
Download and view the complete annual report
Please find page 150 of the 2015 Big Lots annual report below. You can navigate through the pages in the report by either clicking on the pages listed below, or by using the keyword search tool below to find specific information within the annual report.-
 1
1 -
2
-
3
-
4
-
5
-
6
-
7
-
8
-
9
-
10
-
11
-
12
-
13
-
14
-
15
-
16
-
17
-
18
-
19
-
20
-
21
-
22
-
23
-
24
-
25
-
26
-
27
-
28
-
29
-
30
-
31
-
32
-
33
-
34
-
35
-
36
-
37
-
38
-
39
-
40
-
41
-
42
-
43
-
44
-
45
-
46
-
47
-
48
-
49
-
50
-
51
-
52
-
53
-
54
-
55
-
56
-
57
-
58
-
59
-
60
-
61
-
62
-
63
-
64
-
65
-
66
-
67
-
68
-
69
-
70
-
71
-
72
-
73
-
74
-
75
-
76
-
77
-
78
-
79
-
80
-
81
-
82
-
83
-
84
-
85
-
86
-
87
-
88
-
89
-
90
-
91
-
92
-
93
-
94
-
95
-
96
-
97
-
98
-
99
-
100
-
101
-
102
-
103
-
104
-
105
-
106
-
107
-
108
-
109
-
110
-
111
-
112
-
113
-
114
-
115
-
116
-
117
-
118
-
119
-
120
-
121
-
122
-
123
-
124
-
125
-
126
-
127
-
128
-
129
-
130
-
131
-
132
-
133
-
134
-
135
-
136
-
137
-
138
-
139
-
 140
140 -
 141
141 -
 142
142 -
 143
143 -
 144
144 -
 145
145 -
 146
146 -
 147
147 -
 148
148 -
 149
149 -
 150
150 -
 151
151 -
 152
152 -
 153
153 -
 154
154 -
 155
155 -
 156
156 -
 157
157 -
 158
158 -
 159
159 -
 160
160 -
161
-
162
-
163
-
164
-
165
-
166
 |
 |

73
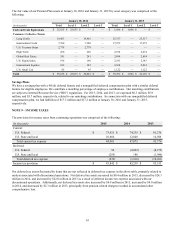
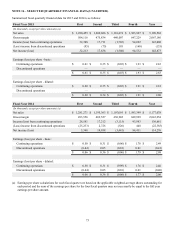
NOTE 16 – SELECTED QUARTERLY FINANCIAL DATA (UNAUDITED)
Summarized fiscal quarterly financial data for 2015 and 2014 is as follows:
Fiscal Year 2015 First Second Third Fourth Year
(In thousands, except per share amounts) (a)
Net sales $ 1,280,455 $ 1,209,686 $ 1,116,474 $ 1,583,967 $ 5,190,582
Gross margin 504,116 475,834 440,007 647,229 2,067,186
Income (loss) from continuing operations 32,308 17,711 (1,703) 94,692 143,008
(Loss) income from discontinued operations (95)(75) 195 (160)(135)
Net income (loss) 32,213 17,636 (1,508) 94,532 142,873
Earnings (loss) per share - basic:
Continuing operations $ 0.61 $ 0.35 $ (0.03) $ 1.93 $ 2.83
Discontinued operations ———— —
$ 0.61 $ 0.35 $ (0.03) $ 1.93 $ 2.83
Earnings (loss) per share - diluted:
Continuing operations $ 0.60 $ 0.35 $ (0.03) $ 1.91 $ 2.81
Discontinued operations ———— —
$ 0.60 $ 0.34 $ (0.03) $ 1.91 $ 2.80
Fiscal Year 2014 First Second Third Fourth Year
(In thousands, except per share amounts) (a)
Net sales $ 1,281,271 $ 1,195,363 $ 1,107,095 $ 1,593,349 $ 5,177,078
Gross margin 493,556 469,527 430,942 649,929 2,043,954
Income (loss) from continuing operations 28,581 17,212 (3,115) 93,983 136,661
(Loss) income from discontinued operations (25,233) 2,726 (326) 448 (22,385)
Net income (loss) 3,348 19,938 (3,441) 94,431 114,276
Earnings (loss) per share - basic:
Continuing operations $ 0.50 $ 0.31 $ (0.06) $ 1.78 $ 2.49
Discontinued operations (0.44) 0.05 (0.01) 0.01 (0.41)
$ 0.06 $ 0.36 $ (0.06) $ 1.79 $ 2.08
Earnings (loss) per share - diluted:
Continuing operations $ 0.50 $ 0.31 $ (0.06) $ 1.76 $ 2.46
Discontinued operations (0.44) 0.05 (0.01) 0.01 (0.40)
$ 0.06 $ 0.36 $ (0.06) $ 1.77 $ 2.06
(a) Earnings per share calculations for each fiscal quarter are based on the applicable weighted-average shares outstanding for
each period and the sum of the earnings per share for the four fiscal quarters may not necessarily be equal to the full year
earnings per share amount.