Big Lots 2015 Annual Report Download - page 106
Download and view the complete annual report
Please find page 106 of the 2015 Big Lots annual report below. You can navigate through the pages in the report by either clicking on the pages listed below, or by using the keyword search tool below to find specific information within the annual report.-
 1
1 -
2
-
3
-
4
-
5
-
6
-
7
-
8
-
9
-
10
-
11
-
12
-
13
-
14
-
15
-
16
-
17
-
18
-
19
-
20
-
21
-
22
-
23
-
24
-
25
-
26
-
27
-
28
-
29
-
30
-
31
-
32
-
33
-
34
-
35
-
36
-
37
-
38
-
39
-
40
-
41
-
42
-
43
-
44
-
45
-
46
-
47
-
48
-
49
-
50
-
51
-
52
-
53
-
54
-
55
-
56
-
57
-
58
-
59
-
60
-
61
-
62
-
63
-
64
-
65
-
66
-
67
-
68
-
69
-
70
-
71
-
72
-
73
-
74
-
75
-
76
-
77
-
78
-
79
-
80
-
81
-
82
-
83
-
84
-
85
-
86
-
87
-
88
-
89
-
90
-
91
-
92
-
93
-
94
-
95
-
 96
96 -
 97
97 -
 98
98 -
 99
99 -
 100
100 -
 101
101 -
 102
102 -
 103
103 -
 104
104 -
 105
105 -
 106
106 -
 107
107 -
 108
108 -
 109
109 -
 110
110 -
 111
111 -
 112
112 -
 113
113 -
 114
114 -
 115
115 -
 116
116 -
117
-
118
-
119
-
120
-
121
-
122
-
123
-
124
-
125
-
126
-
127
-
128
-
129
-
130
-
131
-
132
-
133
-
134
-
135
-
136
-
137
-
138
-
139
-
140
-
141
-
142
-
143
-
144
-
145
-
146
-
147
-
148
-
149
-
150
-
151
-
152
-
153
-
154
-
155
-
156
-
157
-
158
-
159
-
160
-
161
-
162
-
163
-
164
-
165
-
166
 |
 |
29
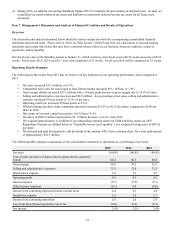
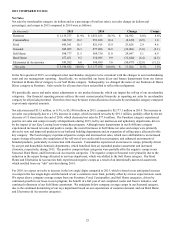
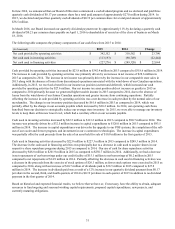
Selling and Administrative Expenses
Selling and administrative expenses were $1,699.8 million in 2014, compared to $1,664.0 million in 2013. The increase of
$35.8 million, or 2.2%, was primarily due to increases in accrued bonus expense of $26.2 million, self-insurance costs of $8.6
million, store occupancy expenses of $5.2 million, corporate office payroll expenses of $2.6 million, and store utilities expense
of $2.3 million, and the absence of a gain on the sale of real estate of $3.6 million. These increases were partially offset by a
decrease in store related payroll of $6.1 million, the absence of a non-recurring litigation settlement of $4.4 million, and a
decrease in share-based compensation expense of $2.7 million. The increase in accrued bonus expense was directly related to
better financial performance in 2014 relative to our annual operating plan as compared to our performance during 2013. The
increase in self-insurance costs was due to an unfavorable development for our self-insurance programs, particularly our
general liability coverage, during the fourth quarter of 2014. The increase in store occupancy expense was primarily the result
of an increase in store rents from the exercise of lease options and property maintenance costs. The increase in corporate office
payroll costs was driven by our investment in our merchandising team and expansion of our marketing team as we develop our
omnichannel strategy. The increase in utilities expense was primarily attributable to the unseasonably cold weather in many
regions of the U.S. during the first quarter of 2014, and the roll-out of our cooler and freezer program, which has gradually
increased our energy consumption. The gain on sale of real estate resulted from our sale of an owned store location in the third
quarter of 2013, which did not recur in 2014. The decrease in store related payroll resulted from a net decrease of 33 stores
compared to 2013. The non-recurring litigation settlement was the result of a loss contingency for a legal matter that was
recognized in the first quarter of 2013 and finalized in the second quarter of 2013. The decrease in share-based compensation
expense was primarily driven by the forfeiture of awards by individuals affected by separation activities and the associated
reversal of costs, and the change in the types of equity instruments awarded in 2014 compared to 2013 (specifically the
replacement of stock options with performance share units which have a different expense recognition pattern).
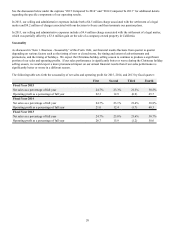
As a percentage of net sales, selling and administrative expenses increased by 30 basis points to 32.8% in 2014 compared to
32.5% in 2013. The primary driver of the 30 basis point increase was the increase of accrued bonus expense which accounted
for a 50 basis point increase partially offset by a 20 basis point leverage in selling and administrative expenses caused by the
increase in net sales. Our future selling and administrative expense as a percentage of net sales rate is dependent upon many
factors including our level of net sales, our ability to implement additional efficiencies, principally in our store and distribution
center operations, and fluctuating commodity prices, such as diesel fuel, which directly affects our outbound transportation
cost.
Depreciation Expense
Depreciation expense increased $6.5 million to $119.7 million in 2014 compared to $113.2 million in 2013. The increase was
directly related to capital expenditures in both 2013 and 2014 associated with the implementation of our cooler and freezer
program, store projects, and maintenance of existing stores and distribution centers. Depreciation expense as a percentage of
net sales increased by 10 basis points compared to 2013.
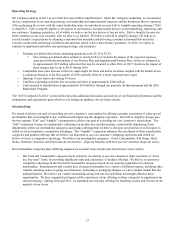
Operating Profit
Operating profit was $224.5 million in 2014 as compared to $230.1 million in 2013. The decrease in operating profit was
primarily driven by the items discussed in the "Net Sales", "Gross Margin", "Selling and Administrative Expenses", and
"Depreciation Expense" sections above. In summary, the increase in our net sales and gross margin was slightly more than
offset by increases in selling and administrative expenses and depreciation expense.
Interest Expense
Interest expense decreased $0.7 million to $2.6 million in 2014 compared to $3.3 million in 2013. The decrease in interest
expense was primarily driven by decreased borrowings in 2014. We had total average borrowings (including capital leases) of
$105.5 million in 2014 compared to total average borrowings of $158.7 million in 2013. The decrease in total average
borrowings was primarily the result of utilizing the excess of our cash inflows from operations, which exceeded cash outflows
from investing activities, to repay portions of our indebtedness.
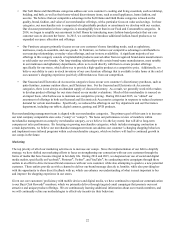
Income Taxes
The effective income tax rate in 2014 and 2013 for income from continuing operations was 38.4% and 37.7%, respectively.
The increase in our effective rate was principally driven by the recognition of fewer employment-related tax credits in 2014 due
to the late 2014 one-year, retroactive renewal of federal hiring credits and the decline in generation of California employment-
related credits due to the termination of the program, coupled with fewer discrete settlement benefits compared to 2013.