Big Lots 2015 Annual Report Download - page 121
Download and view the complete annual report
Please find page 121 of the 2015 Big Lots annual report below. You can navigate through the pages in the report by either clicking on the pages listed below, or by using the keyword search tool below to find specific information within the annual report.-
 1
1 -
2
-
3
-
4
-
5
-
6
-
7
-
8
-
9
-
10
-
11
-
12
-
13
-
14
-
15
-
16
-
17
-
18
-
19
-
20
-
21
-
22
-
23
-
24
-
25
-
26
-
27
-
28
-
29
-
30
-
31
-
32
-
33
-
34
-
35
-
36
-
37
-
38
-
39
-
40
-
41
-
42
-
43
-
44
-
45
-
46
-
47
-
48
-
49
-
50
-
51
-
52
-
53
-
54
-
55
-
56
-
57
-
58
-
59
-
60
-
61
-
62
-
63
-
64
-
65
-
66
-
67
-
68
-
69
-
70
-
71
-
72
-
73
-
74
-
75
-
76
-
77
-
78
-
79
-
80
-
81
-
82
-
83
-
84
-
85
-
86
-
87
-
88
-
89
-
90
-
91
-
92
-
93
-
94
-
95
-
96
-
97
-
98
-
99
-
100
-
101
-
102
-
103
-
104
-
105
-
106
-
107
-
108
-
109
-
110
-
 111
111 -
 112
112 -
 113
113 -
 114
114 -
 115
115 -
 116
116 -
 117
117 -
 118
118 -
 119
119 -
 120
120 -
 121
121 -
 122
122 -
 123
123 -
 124
124 -
 125
125 -
 126
126 -
 127
127 -
 128
128 -
 129
129 -
 130
130 -
 131
131 -
132
-
133
-
134
-
135
-
136
-
137
-
138
-
139
-
140
-
141
-
142
-
143
-
144
-
145
-
146
-
147
-
148
-
149
-
150
-
151
-
152
-
153
-
154
-
155
-
156
-
157
-
158
-
159
-
160
-
161
-
162
-
163
-
164
-
165
-
166
 |
 |

44
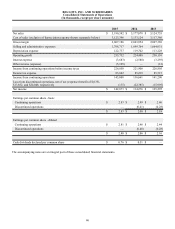
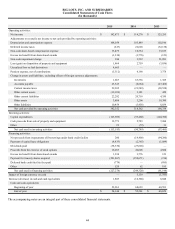
BIG LOTS, INC. AND SUBSIDIARIES
Consolidated Statements of Cash Flows
(In thousands)
2015 2014 2013
Operating activities:
Net income $ 142,873 $ 114,276 $ 125,295
Adjustments to reconcile net income to net cash provided by operating activities:
Depreciation and amortization expense 108,054 105,849 102,196
Deferred income taxes (617) 22,628 (32,138)
Non-cash share-based compensation expense 13,479 10,534 13,183
Excess tax benefit from share-based awards (1,330) (3,776) (123)
Non-cash impairment charge 386 3,532 21,091
Loss (gain) on disposition of property and equipment 1,464 2,759 (3,036)
Unrealized loss on fuel derivatives 4,665 — —
Pension expense, net of contributions (5,312) 4,190 3,378
Change in assets and liabilities, excluding effects of foreign currency adjustments:
Inventories 1,687 63,336 1,385
Accounts payable 23,345 (6,864) (27,468)
Current income taxes 29,305 (21,549) (28,538)
Other current assets (12,189) 3,181 420
Other current liabilities 22,282 20,718 4,350
Other assets 3,806 3,206 10,300
Other liabilities 10,454 (3,458) 8,039
Net cash provided by operating activities 342,352 318,562 198,334
Investing activities:
Capital expenditures (125,989) (93,460) (104,786)
Cash proceeds from sale of property and equipment 12,773 2,783 7,260
Other 23 (72) 31
Net cash used in investing activities (113,193) (90,749) (97,495)
Financing activities:
Net proceeds from (repayments of) borrowings under bank credit facility 200 (14,900) (94,200)
Payment of capital lease obligations (4,433) (2,365) (1,089)
Dividends paid (38,530) (27,828) —
Proceeds from the exercise of stock options 16,283 42,606 4,884
Excess tax benefit from share-based awards 1,330 3,776 123
Payment for treasury shares acquired (201,867) (250,671) (214)
Deferred bank credit facility fees paid (779) — (895)
Other 520 62 195
Net cash used in financing activities (227,276) (249,320) (91,196)
Impact of foreign currency on cash — 5,139 (1,595)
Increase (decrease) in cash and cash equivalents 1,883 (16,368) 8,048
Cash and cash equivalents:
Beginning of year 52,261 68,629 60,581
End of year $ 54,144 $ 52,261 $ 68,629
The accompanying notes are an integral part of these consolidated financial statements.