Big Lots 2015 Annual Report Download - page 117
Download and view the complete annual report
Please find page 117 of the 2015 Big Lots annual report below. You can navigate through the pages in the report by either clicking on the pages listed below, or by using the keyword search tool below to find specific information within the annual report.-
 1
1 -
2
-
3
-
4
-
5
-
6
-
7
-
8
-
9
-
10
-
11
-
12
-
13
-
14
-
15
-
16
-
17
-
18
-
19
-
20
-
21
-
22
-
23
-
24
-
25
-
26
-
27
-
28
-
29
-
30
-
31
-
32
-
33
-
34
-
35
-
36
-
37
-
38
-
39
-
40
-
41
-
42
-
43
-
44
-
45
-
46
-
47
-
48
-
49
-
50
-
51
-
52
-
53
-
54
-
55
-
56
-
57
-
58
-
59
-
60
-
61
-
62
-
63
-
64
-
65
-
66
-
67
-
68
-
69
-
70
-
71
-
72
-
73
-
74
-
75
-
76
-
77
-
78
-
79
-
80
-
81
-
82
-
83
-
84
-
85
-
86
-
87
-
88
-
89
-
90
-
91
-
92
-
93
-
94
-
95
-
96
-
97
-
98
-
99
-
100
-
101
-
102
-
103
-
104
-
105
-
106
-
 107
107 -
 108
108 -
 109
109 -
 110
110 -
 111
111 -
 112
112 -
 113
113 -
 114
114 -
 115
115 -
 116
116 -
 117
117 -
 118
118 -
 119
119 -
 120
120 -
 121
121 -
 122
122 -
 123
123 -
 124
124 -
 125
125 -
 126
126 -
 127
127 -
128
-
129
-
130
-
131
-
132
-
133
-
134
-
135
-
136
-
137
-
138
-
139
-
140
-
141
-
142
-
143
-
144
-
145
-
146
-
147
-
148
-
149
-
150
-
151
-
152
-
153
-
154
-
155
-
156
-
157
-
158
-
159
-
160
-
161
-
162
-
163
-
164
-
165
-
166
 |
 |

40
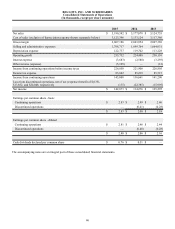
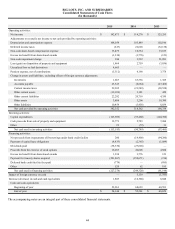
BIG LOTS, INC. AND SUBSIDIARIES
Consolidated Statements of Operations
(In thousands, except per share amounts)
2015 2014 2013
Net sales $ 5,190,582 $ 5,177,078 $ 5,124,755
Cost of sales (exclusive of depreciation expense shown separately below) 3,123,396 3,133,124 3,117,386
Gross margin 2,067,186 2,043,954 2,007,369
Selling and administrative expenses 1,708,717 1,699,764 1,664,031
Depreciation expense 122,737 119,702 113,228
Operating profit 235,732 224,488 230,110
Interest expense (3,683)(2,588)(3,293)
Other income (expense) (5,199)—(12)
Income from continuing operations before income taxes 226,850 221,900 226,805
Income tax expense 83,842 85,239 85,515
Income from continuing operations 143,008 136,661 141,290
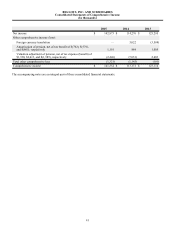
Loss from discontinued operations, net of tax (expense) benefit of $(135),
$13,852, and $24,046, respectively (135)(22,385)(15,995)
Net income $ 142,873 $ 114,276 $ 125,295
Earnings per common share - basic
Continuing operations $ 2.83 $ 2.49 $ 2.46
Discontinued operations — (0.41)(0.28)
$ 2.83 $ 2.08 $ 2.18
Earnings per common share - diluted
Continuing operations $ 2.81 $ 2.46 $ 2.44
Discontinued operations — (0.40)(0.28)
$ 2.80 $ 2.06 $ 2.16
Cash dividends declared per common share $ 0.76 $ 0.51 $ —
The accompanying notes are an integral part of these consolidated financial statements.