Albertsons 2016 Annual Report Download - page 92
Download and view the complete annual report
Please find page 92 of the 2016 Albertsons annual report below. You can navigate through the pages in the report by either clicking on the pages listed below, or by using the keyword search tool below to find specific information within the annual report.-
 1
1 -
2
-
3
-
4
-
5
-
6
-
7
-
8
-
9
-
10
-
11
-
12
-
13
-
14
-
15
-
16
-
17
-
18
-
19
-
20
-
21
-
22
-
23
-
24
-
25
-
26
-
27
-
28
-
29
-
30
-
31
-
32
-
33
-
34
-
35
-
36
-
37
-
38
-
39
-
40
-
41
-
42
-
43
-
44
-
45
-
46
-
47
-
48
-
49
-
50
-
51
-
52
-
53
-
54
-
55
-
56
-
57
-
58
-
59
-
60
-
61
-
62
-
63
-
64
-
65
-
66
-
67
-
68
-
69
-
70
-
71
-
72
-
73
-
74
-
75
-
76
-
77
-
78
-
79
-
80
-
81
-
 82
82 -
 83
83 -
 84
84 -
 85
85 -
 86
86 -
 87
87 -
 88
88 -
 89
89 -
 90
90 -
 91
91 -
 92
92 -
 93
93 -
 94
94 -
 95
95 -
 96
96 -
 97
97 -
 98
98 -
 99
99 -
 100
100 -
 101
101 -
 102
102 -
103
-
104
-
105
-
106
-
107
-
108
-
109
-
110
-
111
-
112
-
113
-
114
-
115
-
116
-
117
-
118
-
119
-
120
-
121
-
122
-
123
-
124
-
125
 |
 |

90
Mortgage backed securities—Valued based on yields currently available on comparable securities of issuers with similar
credit ratings. When quoted prices are not available for identical or similar securities, the fair value is based upon an
industry valuation model, which maximizes observable inputs.
Private equity and real estate partnerships—Valued using the most recent general partner statement of fair value, updated
for any subsequent partnership interests’ cash flows or expected changes in fair value.
Mutual funds—Mutual funds are valued at the closing price reported in the active market in which the individual securities
are traded.
Synthetic guaranteed investment contract—Valued by discounting the related cash flows based on current yields of similar
instruments with comparable durations considering the credit-worthiness of the issuer.
Other—Valued under an approach that maximizes observable inputs, such as gathering consensus data from the market
participant’s best estimate of mid-market pricing for actual trades or positions held.
The valuation methods described above may produce a fair value calculation that may not be indicative of net realizable value
or reflective of future fair values. Furthermore, while the Company believes its valuation methods are appropriate and
consistent with other market participants, the use of different methodologies or assumptions to determine the fair value of
certain financial instruments could result in a different fair value measurement.
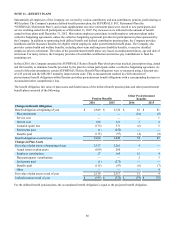
The fair value of assets of the Company’s defined benefit pension plans held in a master trust as of February 27, 2016, by asset
category, consisted of the following:
Level 1 Level 2 Level 3 Total
Common stock $ 432 $ — $ — $ 432
Common collective trusts—fixed income — 554 — 554
Common collective trusts—equity — 212 — 212
Government securities 49 114 — 163
Mutual funds 56 179 — 235
Corporate bonds — 201 — 201
Real estate partnerships — — 164 164
Private equity — — 141 141
Mortgage-backed securities — 14 — 14
Other — 3 — 3
Total plan assets at fair value $ 537 $ 1,277 $ 305 $ 2,119
The fair value of assets of the Company’s defined benefit pension plans held in a master trust as of February 28, 2015, by asset
category, consisted of the following:
Level 1 Level 2 Level 3 Total
Common stock $ 489 $ — $ — $ 489
Common collective trusts—fixed income — 259 — 259
Common collective trusts—equity — 336 — 336
Government securities 95 130 — 225
Mutual funds 53 286 — 339
Corporate bonds — 292 — 292
Real estate partnerships — — 162 162
Private equity — — 144 144
Mortgage-backed securities — 17 — 17
Other 48 6 — 54
Total plan assets at fair value $ 685 $ 1,326 $ 306 $ 2,317