Albertsons 2016 Annual Report Download - page 36
Download and view the complete annual report
Please find page 36 of the 2016 Albertsons annual report below. You can navigate through the pages in the report by either clicking on the pages listed below, or by using the keyword search tool below to find specific information within the annual report.-
 1
1 -
2
-
3
-
4
-
5
-
6
-
7
-
8
-
9
-
10
-
11
-
12
-
13
-
14
-
15
-
16
-
17
-
18
-
19
-
20
-
21
-
22
-
23
-
24
-
25
-
 26
26 -
 27
27 -
 28
28 -
 29
29 -
 30
30 -
 31
31 -
 32
32 -
 33
33 -
 34
34 -
 35
35 -
 36
36 -
 37
37 -
 38
38 -
 39
39 -
 40
40 -
 41
41 -
 42
42 -
 43
43 -
 44
44 -
 45
45 -
 46
46 -
47
-
48
-
49
-
50
-
51
-
52
-
53
-
54
-
55
-
56
-
57
-
58
-
59
-
60
-
61
-
62
-
63
-
64
-
65
-
66
-
67
-
68
-
69
-
70
-
71
-
72
-
73
-
74
-
75
-
76
-
77
-
78
-
79
-
80
-
81
-
82
-
83
-
84
-
85
-
86
-
87
-
88
-
89
-
90
-
91
-
92
-
93
-
94
-
95
-
96
-
97
-
98
-
99
-
100
-
101
-
102
-
103
-
104
-
105
-
106
-
107
-
108
-
109
-
110
-
111
-
112
-
113
-
114
-
115
-
116
-
117
-
118
-
119
-
120
-
121
-
122
-
123
-
124
-
125
 |
 |

34
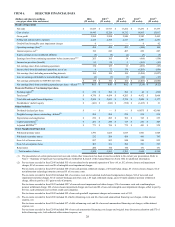
(4) Customer count is defined as the number of transactions by the Company's retail customers within its corporate retail stores operating for four full
quarters, including store expansions and excluding fuel and planned store dispositions.
(5) Retail identical store sales are defined as net sales from stores operating for four full quarters, including store expansions and excluding fuel and
announced planned store dispositions.
(6) Reported identical store sales variances for the fiscal year ended February 28, 2015 exclude the impact of the additional week in fiscal 2015 for
comparative purposes.
Planned store dispositions are Save-A-Lot or Retail stores that the Company has announced it will close or licensee stores that a licensee has notified the
Company it will close, although these stores may not have been closed by the end of the applicable reporting period.
Comparison of fiscal 2016 ended February 27, 2016 and fiscal 2015 ended February 28, 2015:
Net Sales
Net sales for fiscal 2016 were $17,529, compared with $17,917 last year, a decrease of $388 or 2.2 percent. Fiscal 2015 contained
an additional week, which added approximately $313 to Net sales in fiscal 2015. Wholesale net sales were 45.3 percent of Net
sales, Save-A-Lot net sales were 26.4 percent of Net sales, Retail net sales were 27.2 percent of Net sales and Corporate fees
earned under the TSA with NAI and Albertson's LLC and the Haggen TSA were 1.1 percent of Net sales for fiscal 2016,
compared with 45.8 percent, 25.8 percent, 27.3 percent and 1.1 percent, respectively, for last year.
Wholesale net sales for fiscal 2016 were $7,935, compared with $8,198 last year, a decrease of $263 or 3.2 percent. The
additional week in fiscal 2015 contributed $143 to net sales. Excluding the additional week of sales in fiscal 2015, Wholesale net
sales decreased $120 primarily due to $286 of lower sales from lost customers and $210 of lower sales to existing customers,
offset in part by $375 of higher sales from new stores operated by new and existing customers.
Save-A-Lot net sales for fiscal 2016 were $4,623, compared with $4,641 last year, a decrease of $18 or 0.4 percent. The
additional week in fiscal 2015 contributed $79 to net sales. Excluding the additional week of sales in fiscal 2015, Save-A-Lot net
sales increased $61 primarily due to $124 of higher sales from new corporate stores, $60 of higher sales from new licensee stores,
$56 of higher sales from corporate stores that were acquired and converted to licensee stores and $11 of higher sales at existing
corporate stores, offset in part by lower sales of $70 from lower sales to existing licensees, $55 from stores that were disposed of
by licensees, $41 from licensee stores that were converted to corporate stores and $31 from corporate stores that were closed.
Management believes the lower Save-A-Lot network identical store sales in fiscal 2016 compared to fiscal 2015 were driven by a
lower number of product units sold and product cost deflation passed on to licensees. Management also believes the lower Save-
A-Lot corporate stores customer count in fiscal 2016 compared to fiscal 2015 was driven by lower promotional activity.
Retail net sales for fiscal 2016 were $4,769, compared with $4,884 last year, a decrease of $115 or 2.4 percent. The additional
week in fiscal 2015 contributed $87 to net sales. Excluding the additional week of sales in fiscal 2015, Retail net sales decreased
$28 primarily due to $109 of negative identical store sales, $26 of lower sales from closed stores and $14 from lower fuel sales,
offset in part by $122 of higher sales from acquired and new stores. Management believes the lower Retail identical store sales
and customer count in fiscal 2016 compared to fiscal 2015 were driven by adjustments to pricing and promotional activity to
partially mitigate compressed pharmacy margins.
Corporate net sales for fiscal 2016 include fees earned under transition service agreements of $202, compared with $194 last year,
an increase of $8. The additional week in fiscal 2015 contributed $4 to net sales. Excluding the additional week of sales in fiscal
2015, Corporate net sales increased $12 due to the additional transition service fees from the Haggen TSA and wind-down
transition service revenues from Albertson’s LLC and NAI, offset in part by lower TSA fees from a lower number of NAI and
Albertson's LLC stores under their TSA. The Company anticipates TSA revenues to continue to decline in future years as
transition support services under the existing TSA are reduced.
Gross Profit
Gross profit for fiscal 2016 was $2,584, compared with $2,588 last year, a decrease of $4 or 0.2 percent. Gross profit as a percent
of Net sales was 14.7 percent for fiscal 2016, compared with 14.4 percent last year. The additional week in fiscal 2015
contributed approximately $49 to Gross profit. Excluding the additional week, Gross profit increased $45 primarily due to $40 of
higher base margins, $24 of lower logistics costs primarily driven by lower diesel costs, $12 of higher transition service
agreement fees, $8 of higher trucking back-haul income and $3 of lower pension expense, offset in part by $17 of higher
employee-related costs, $16 of higher inventory shrink costs and $10 of higher occupancy costs.
Wholesale gross profit was $383 or 4.8 percent of Wholesale net sales, compared with $388 or 4.7 percent last year. The
additional week in fiscal 2015 contributed approximately $8 to Wholesale gross profit. Excluding the additional week, Wholesale
gross profit increased $3 primarily due to $14 of higher base margins primarily from vendor rebates and allowances, $11 of lower
logistics costs, $4 of higher trucking back-haul income and $3 of lower pension expense, offset in part by $19 of higher